> ## Documentation Index
> Fetch the complete documentation index at: https://docs.xpander.ai/llms.txt
> Use this file to discover all available pages before exploring further.
# Datadog
> Learn how to integrate AI agents with Datadog using xpander.ai. Create intelligent observability workflows that automatically detect anomalies, correlate incidents across your stack, and trigger remediation actions.
## About Datadog
Datadog offers a Software-as-a-Service (SaaS) platform that provides observability across an organization's entire technology stack.
Key features include:
* **Infrastructure Monitoring**: Real-time tracking of servers, containers, databases, and cloud services.
* **Application Performance Monitoring (APM)**: End-to-end tracing and diagnostics for applications.
* **Log Management**: Centralized logging with search and analytics capabilities.
* **Security Monitoring**: Threat detection and compliance monitoring.
* **User Experience Monitoring**: Frontend performance metrics and session data.
* **Network Monitoring**: Visibility into network traffic and device performance.
## Authentication Options
Below are possible authentication options you can choose:
### Generate a Datadog API Key
1. Log in to your [Datadog account](https://app.datadoghq.com/). Make sure you log in to the correct Datadog region for your account.
2. In the sidebar, click on **Go to**, type **API Keys**, and select **API Keys** from the search results.
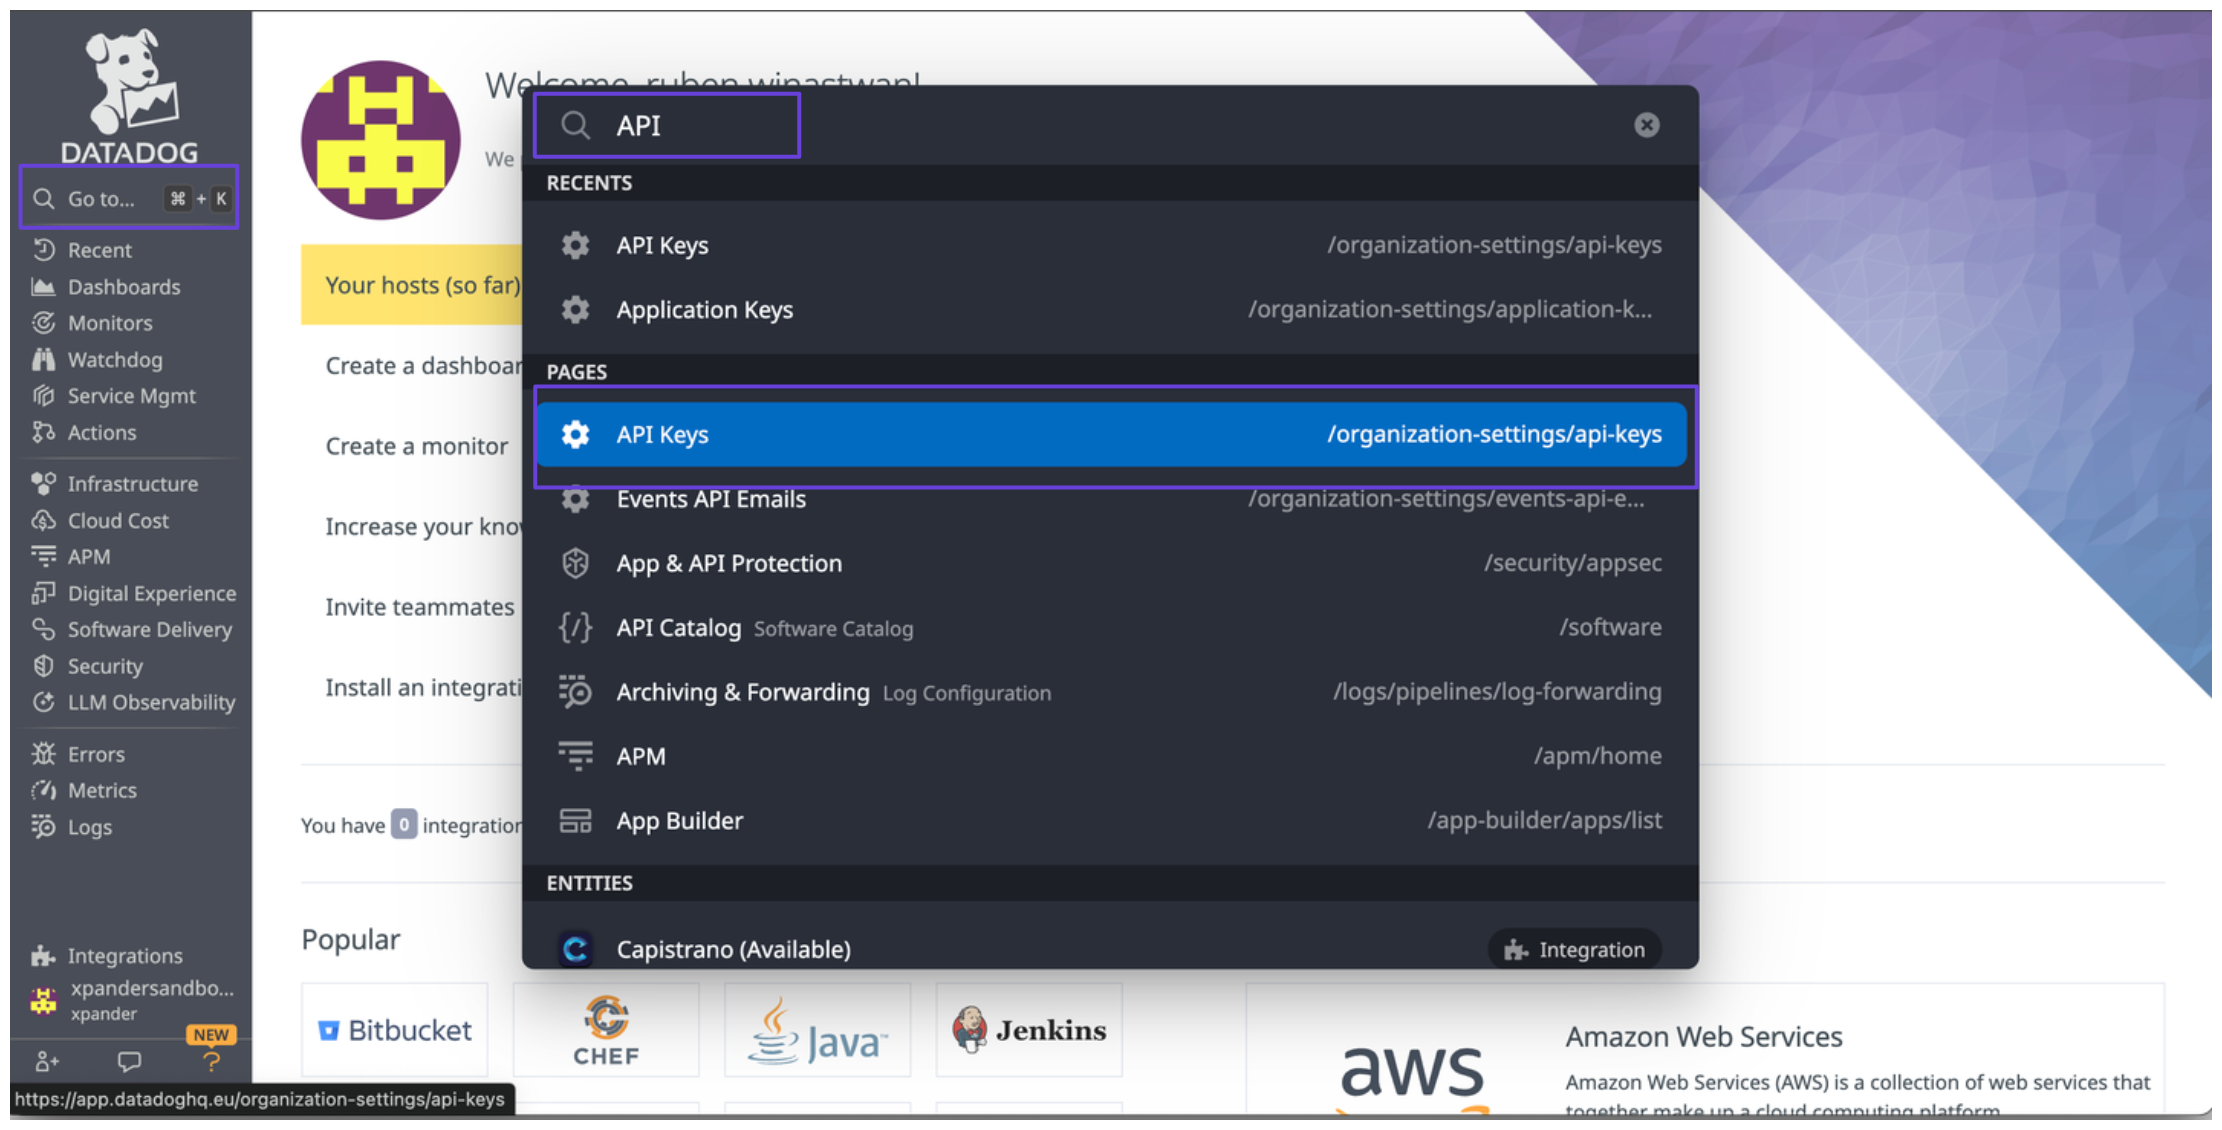 3. You’ll now see the API keys for your Datadog account.
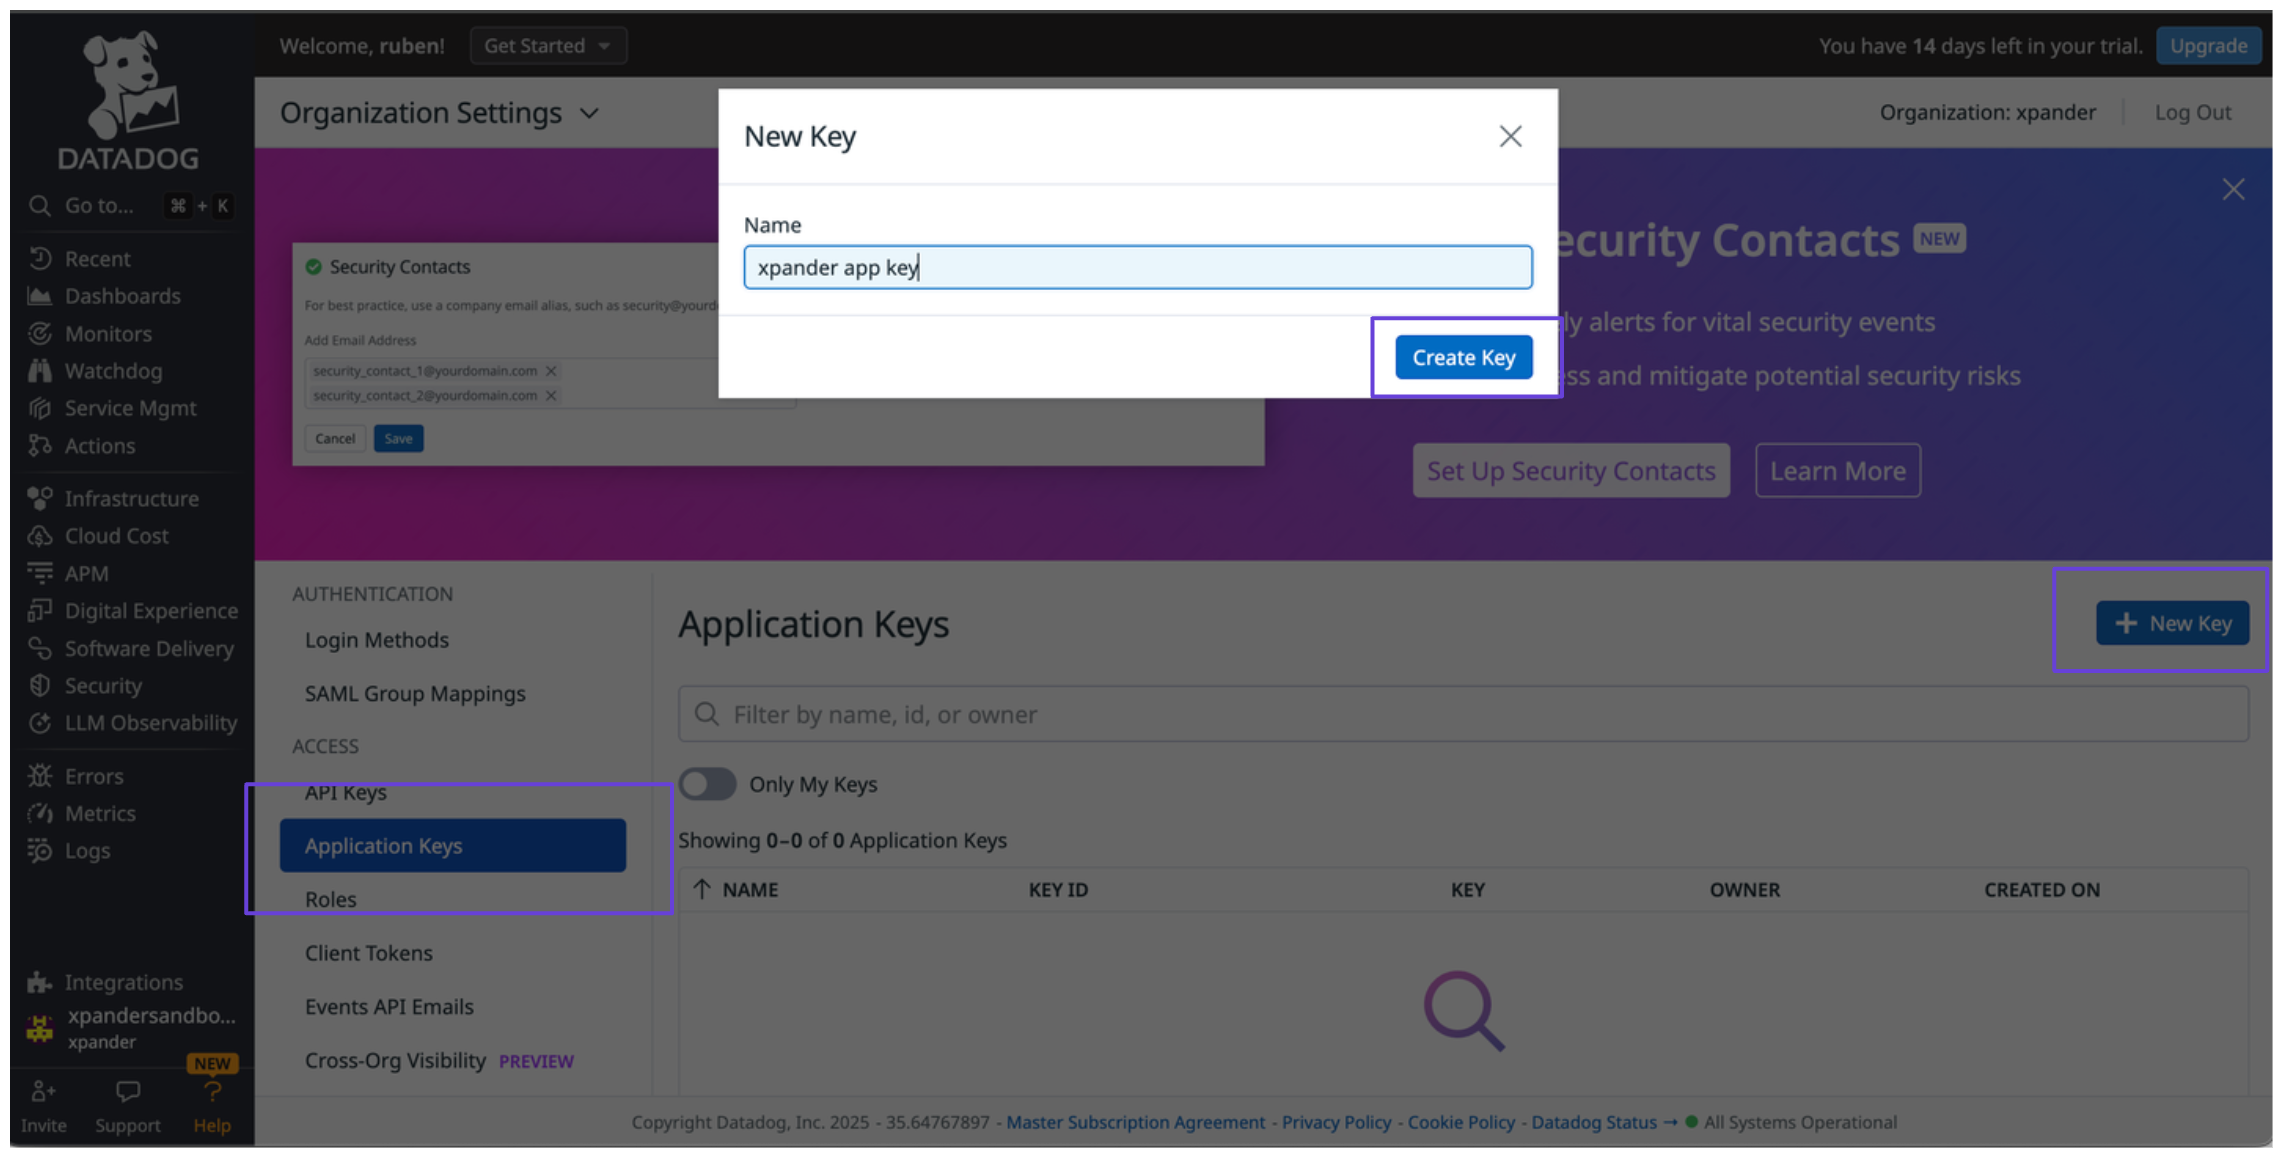
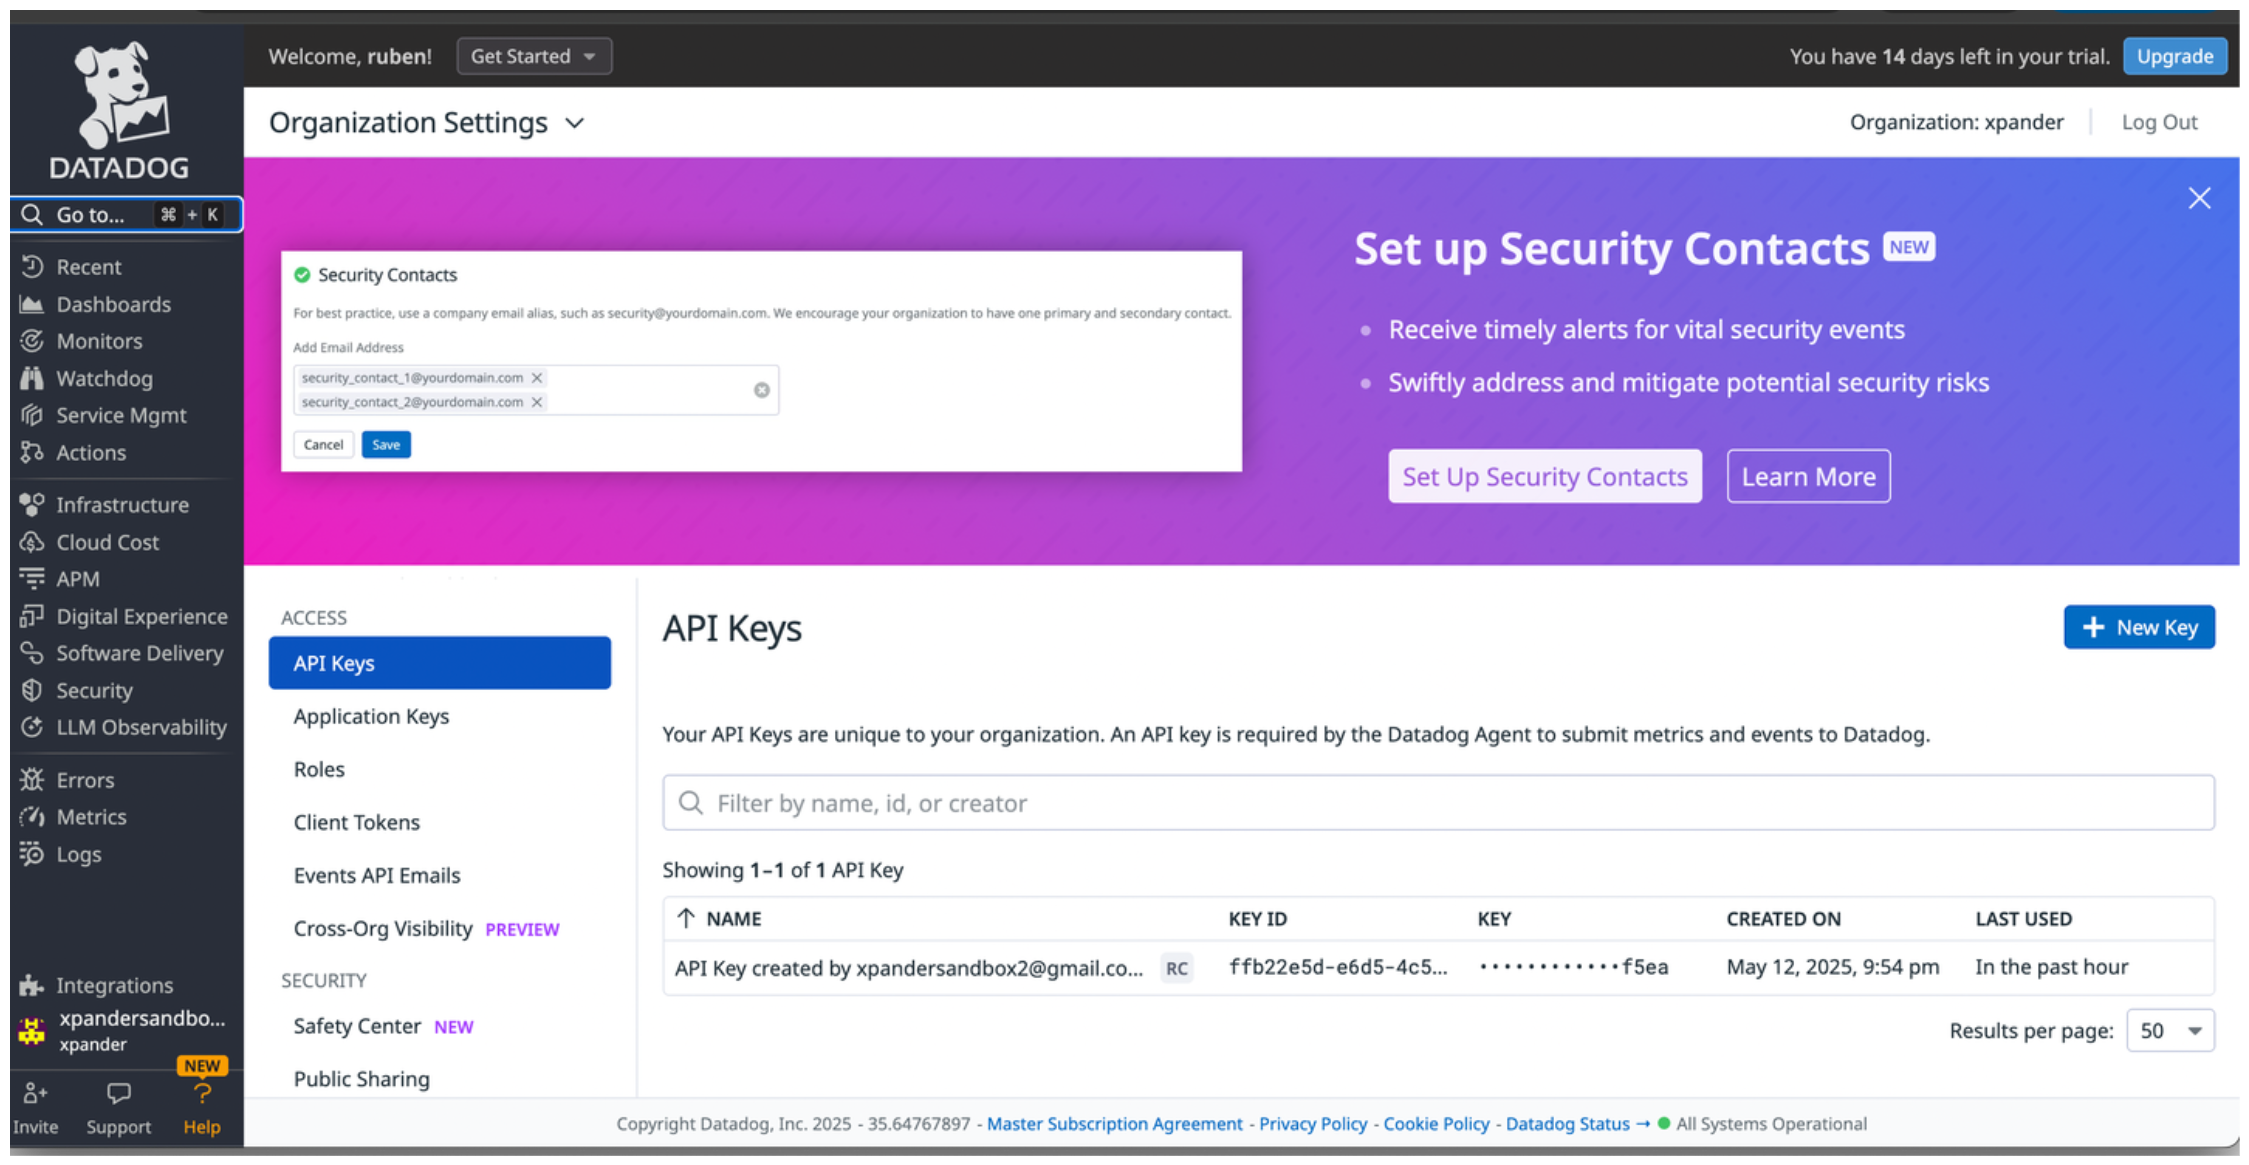 4. To access the Datadog API, you’ll also need an application key.
5. In the sidebar, click on **Application Keys**, then click **New Key**.
6. Give your key a name and assign the necessary scopes based on your use case.
4. To access the Datadog API, you’ll also need an application key.
5. In the sidebar, click on **Application Keys**, then click **New Key**.
6. Give your key a name and assign the necessary scopes based on your use case.
 ### Integrate Datadog into xpander.ai
1. In your xpander.ai dashboard, go to the **Connectors** section in the sidebar.
2. Select **Datadog** from the available integrations.
3. Click **Enable**.
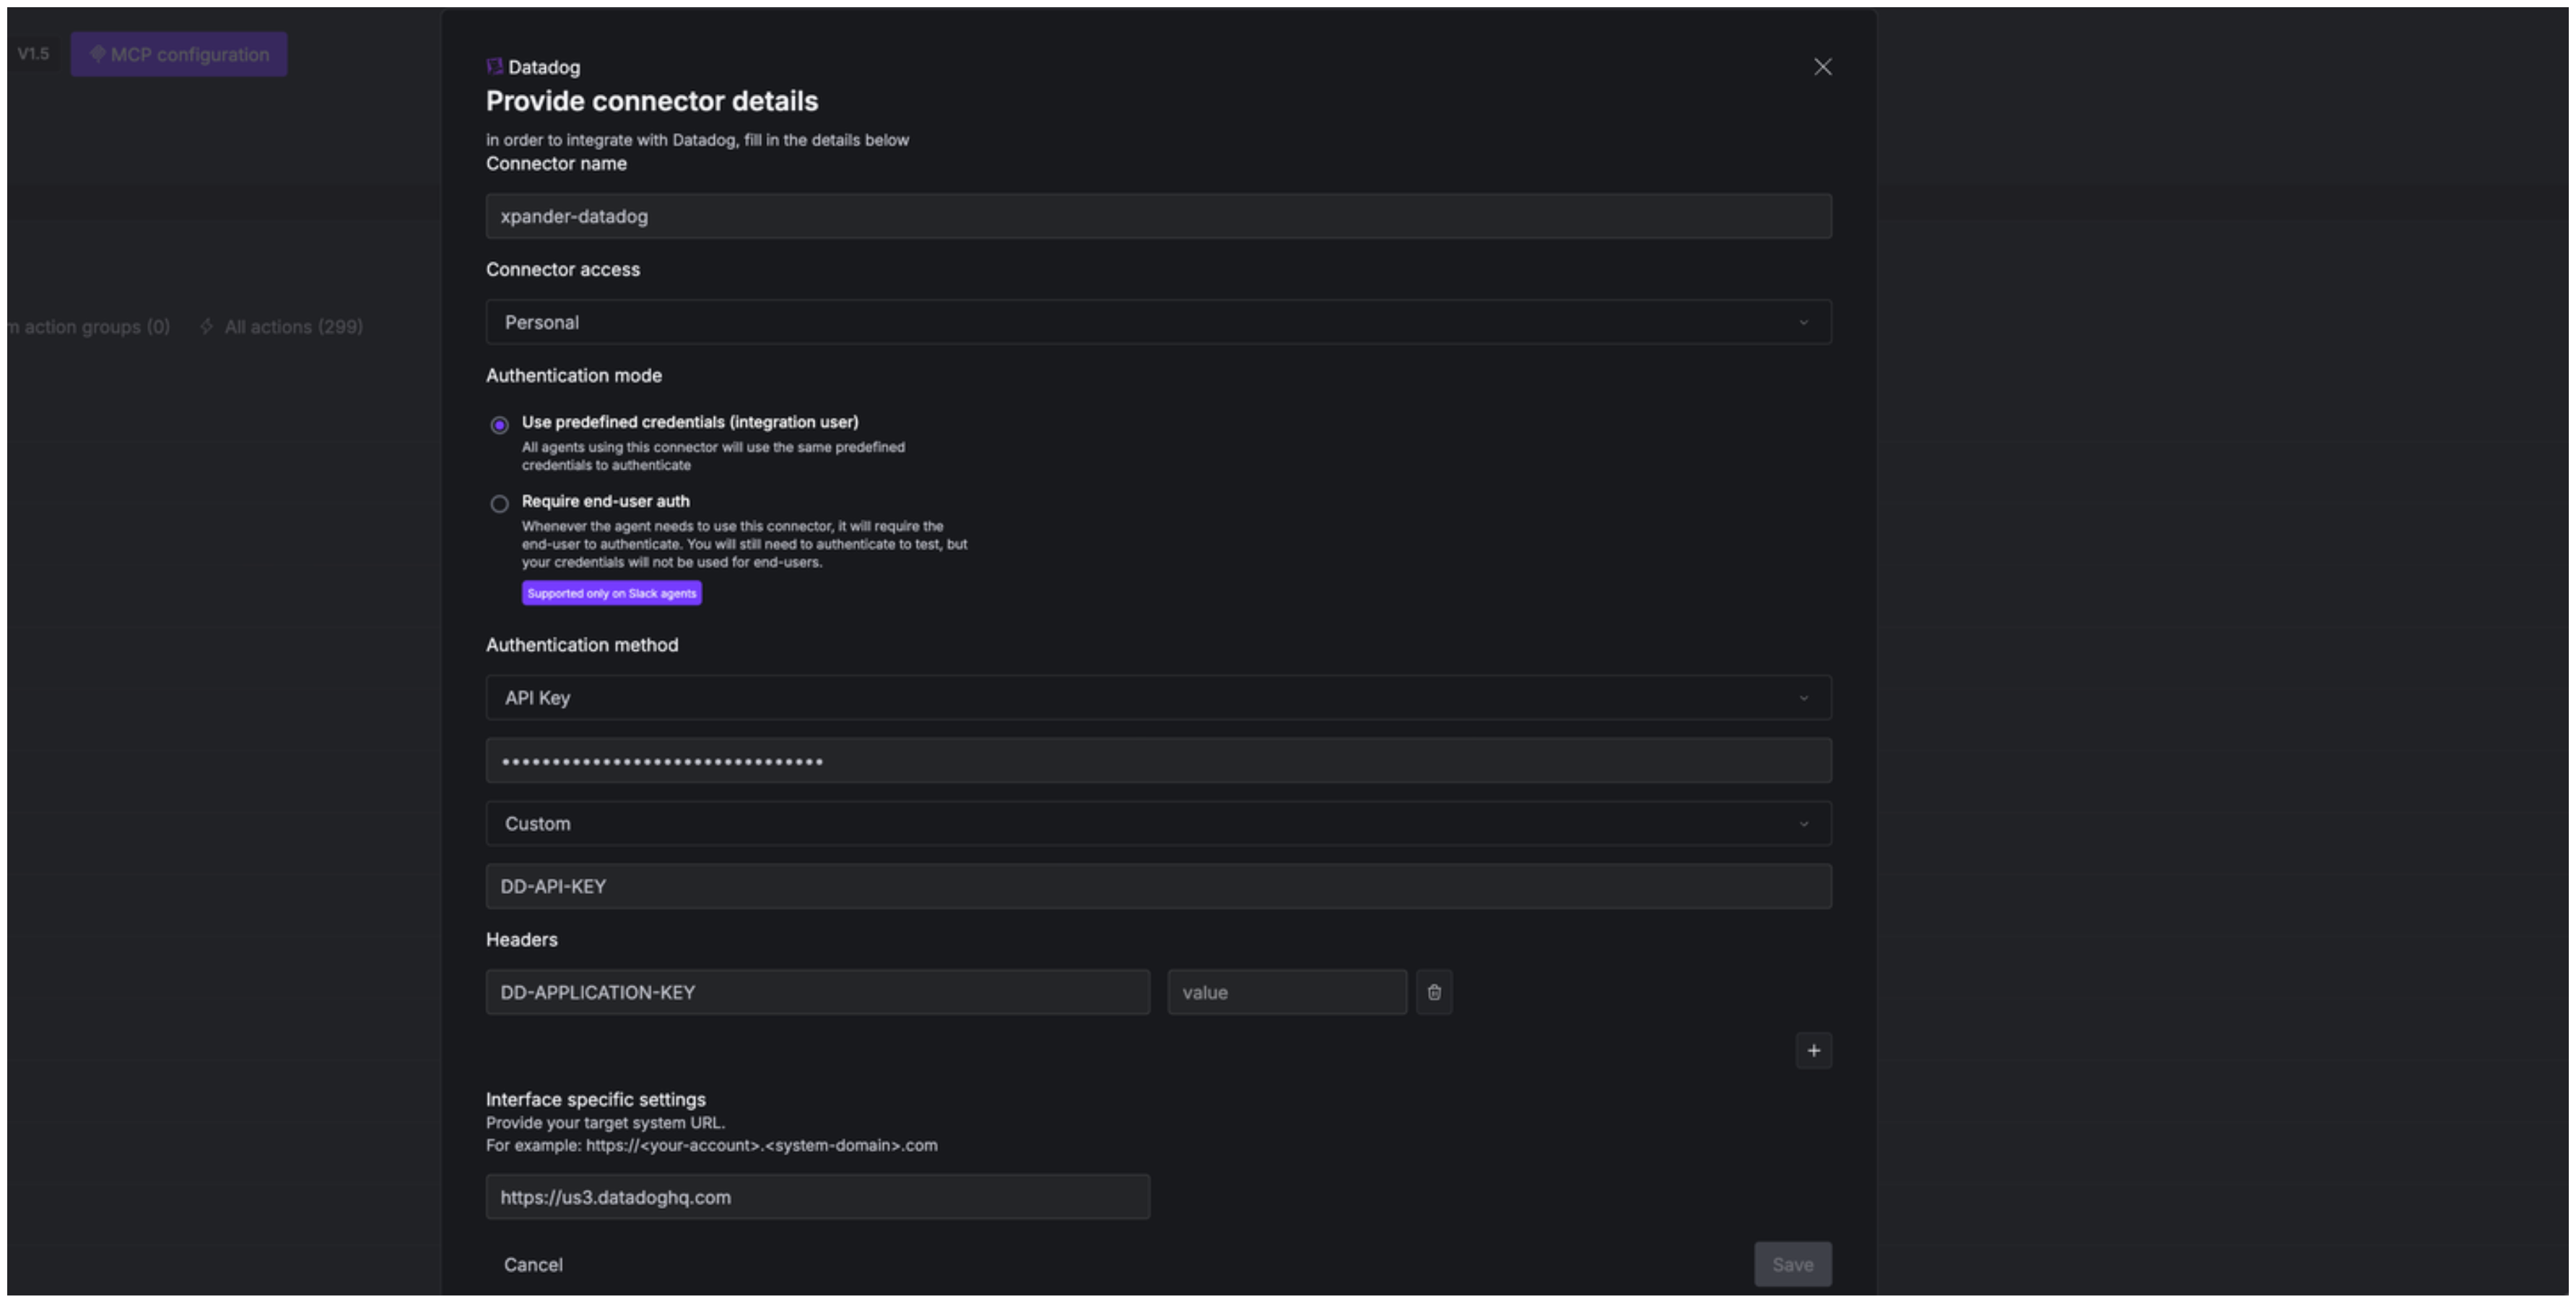
4. Enter a **connector name**, e.g., "xpander-datadog".
5. Choose **Integration User** as the authentication mode.
6. Select **API Key** as the authentication method.
7. Paste your Datadog API key into the provided field.
8. Set the **Auth Type** to **Custom**.
9. In the **Custom header name** field, enter `DD-API-KEY`.
10. Paste your Datadog application key into the **DD-APPLICATION-KEY** field.
11. Under **Interface specific settings**, enter the base URL: `https://api.datadoghq.{domain}/`, replacing **{domain}** with the domain corresponding to your Datadog account region.
12. Save the configuration.
### Integrate Datadog into xpander.ai
1. In your xpander.ai dashboard, go to the **Connectors** section in the sidebar.
2. Select **Datadog** from the available integrations.
3. Click **Enable**.
4. Enter a **connector name**, e.g., "xpander-datadog".
5. Choose **Integration User** as the authentication mode.
6. Select **API Key** as the authentication method.
7. Paste your Datadog API key into the provided field.
8. Set the **Auth Type** to **Custom**.
9. In the **Custom header name** field, enter `DD-API-KEY`.
10. Paste your Datadog application key into the **DD-APPLICATION-KEY** field.
11. Under **Interface specific settings**, enter the base URL: `https://api.datadoghq.{domain}/`, replacing **{domain}** with the domain corresponding to your Datadog account region.
12. Save the configuration.
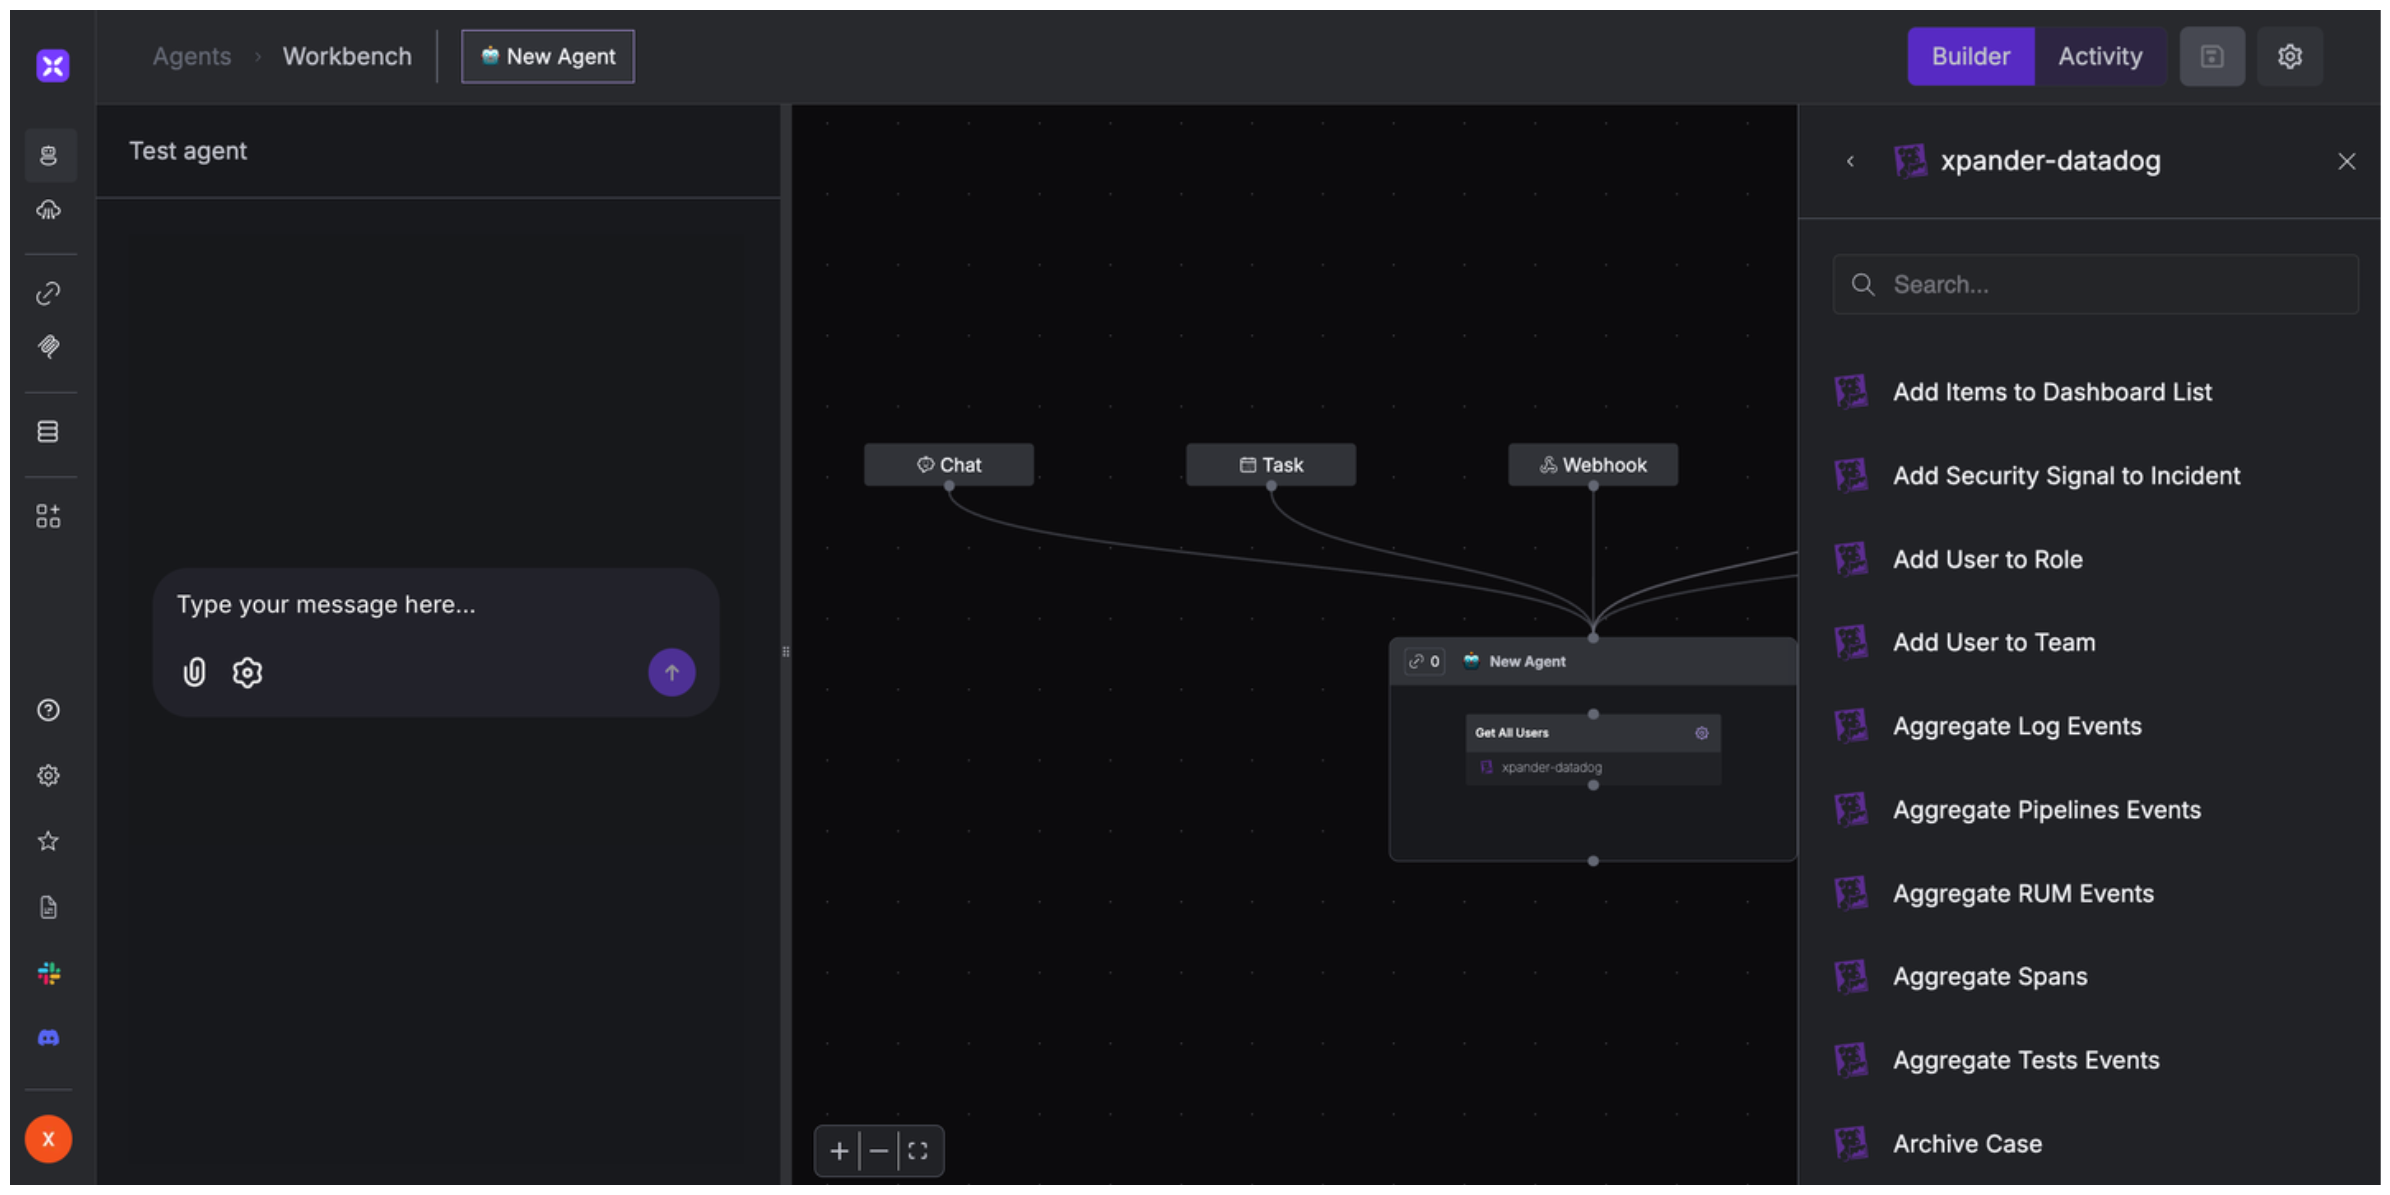
 ## Integration of Datadog into AI Agent
Once you've configured your Datadog account with the authentication option(s) described above, you can integrate it into your AI agent with xpander.ai:
1. In your xpander.ai dashboard, go to the **Agent Configuration** tab and select **Tools**, then click **Add Tools**.
2. Select **Connectors**.
3. Choose **Datadog** with the same **connector name** you configured in the previous section (e.g., xpander-datadog).
4. Select the available Datadog operations that suit your use case.
## Integration of Datadog into AI Agent
Once you've configured your Datadog account with the authentication option(s) described above, you can integrate it into your AI agent with xpander.ai:
1. In your xpander.ai dashboard, go to the **Agent Configuration** tab and select **Tools**, then click **Add Tools**.
2. Select **Connectors**.
3. Choose **Datadog** with the same **connector name** you configured in the previous section (e.g., xpander-datadog).
4. Select the available Datadog operations that suit your use case.
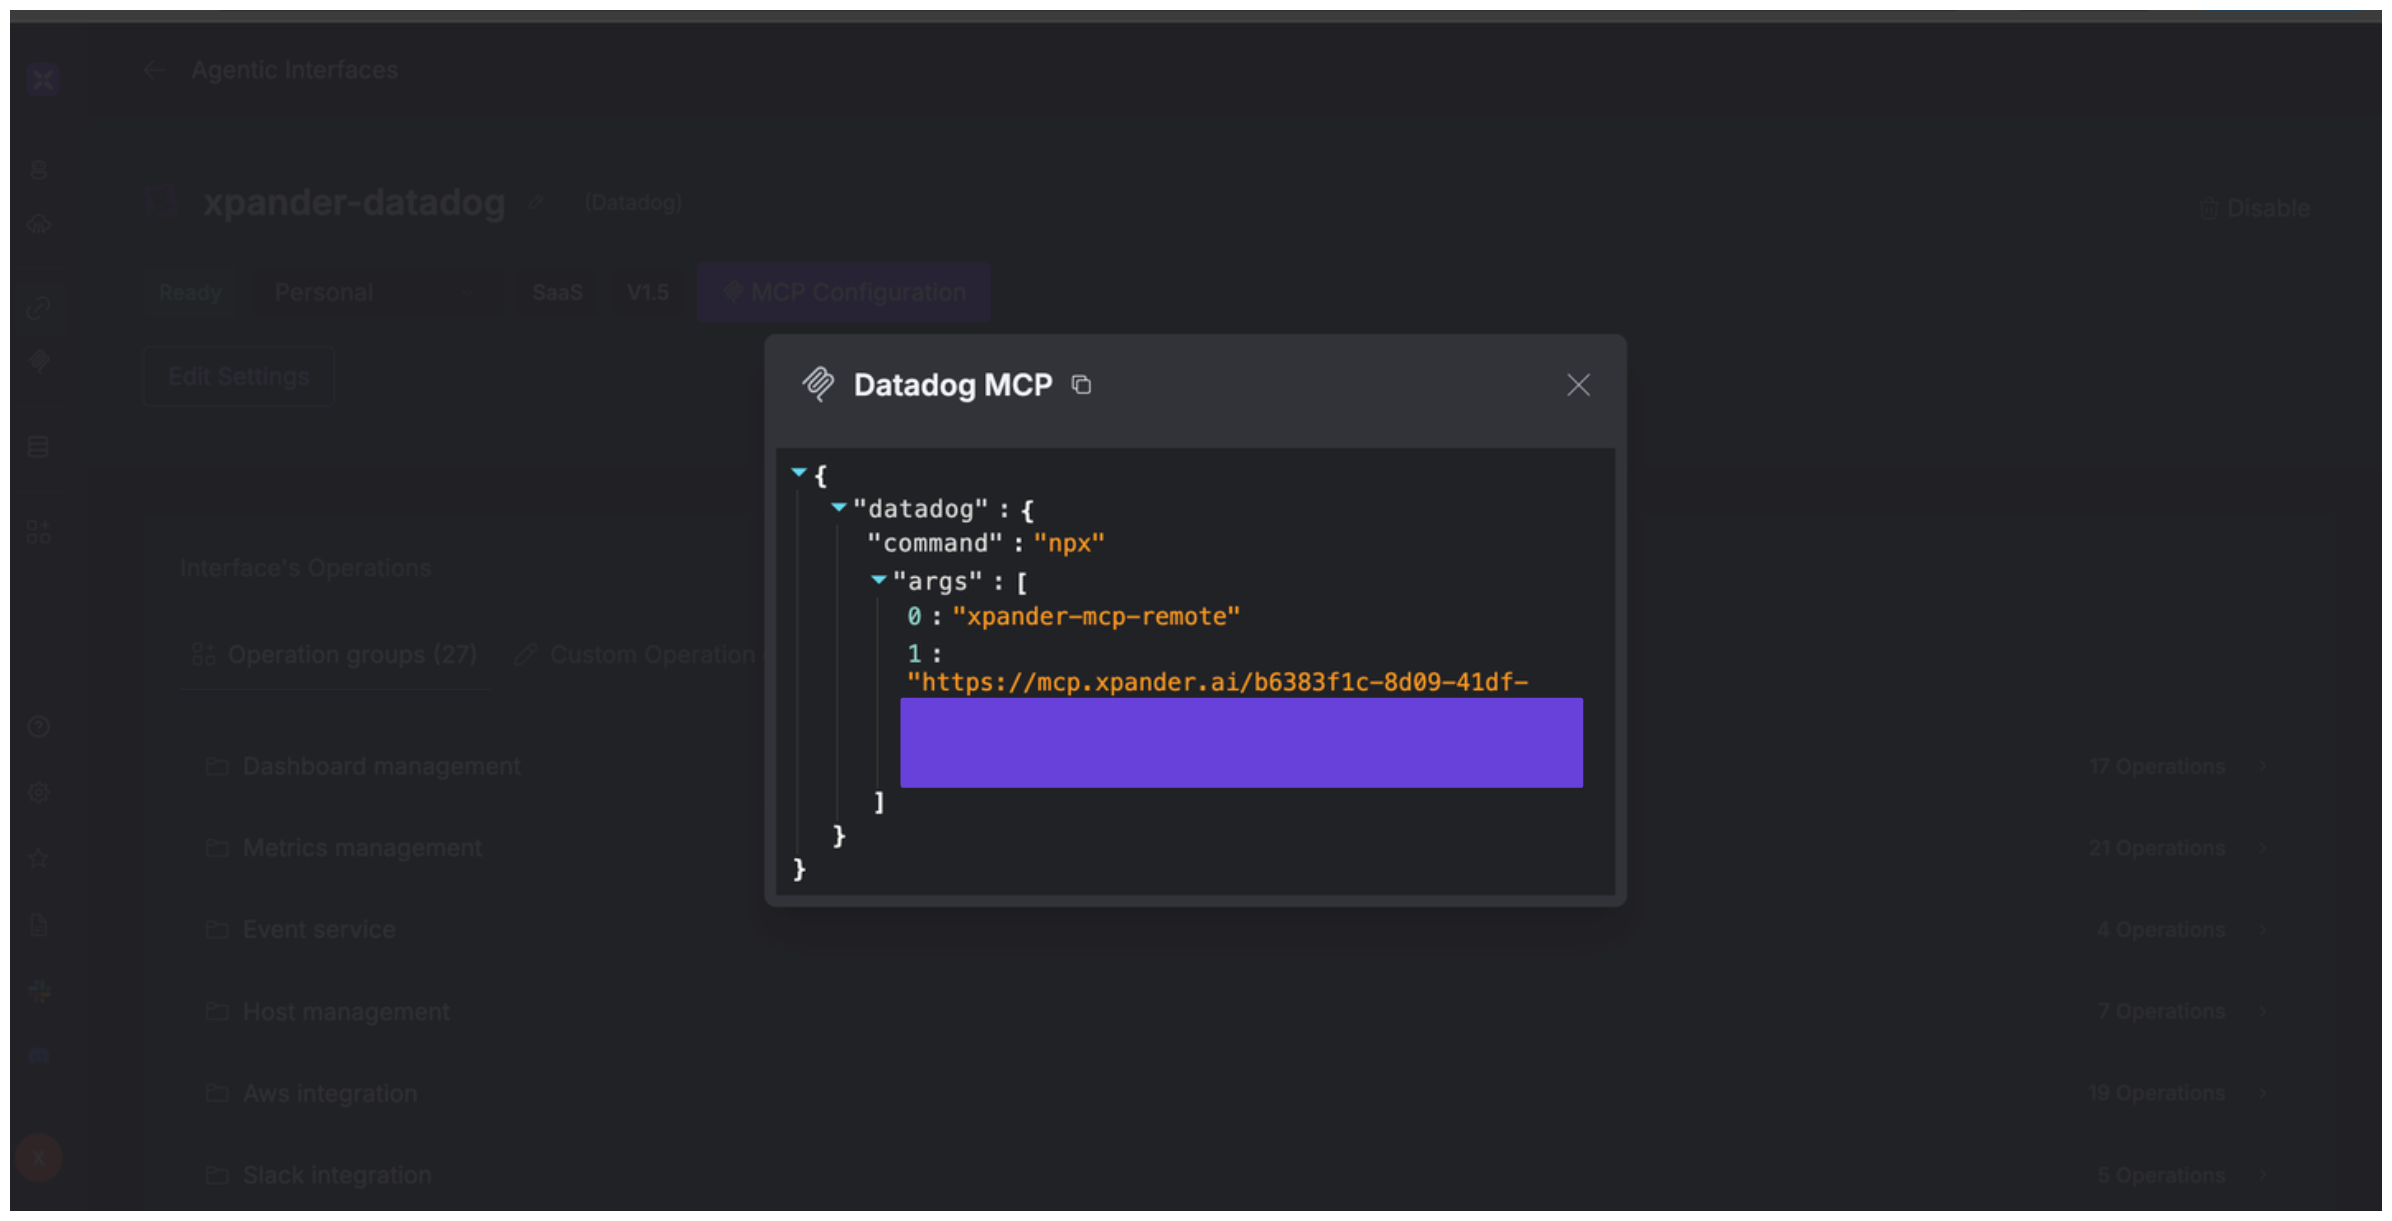
 ## Expose Datadog as MCP Server
Alternatively, you can also expose your Datadog account as an MCP server. To do so:
1. Go to the **Connectors** section in the sidebar of your xpander.ai dashboard.
2. Select **Datadog** with the same **connector name** you configured in the previous section (e.g., xpander-datadog).
3. Click **MCP Configuration**.
4. Enter the MCP configuration into the appropriate settings of the client app you want to use (e.g., Cursor, Windsurf, Claude Desktop, etc.).
## Expose Datadog as MCP Server
Alternatively, you can also expose your Datadog account as an MCP server. To do so:
1. Go to the **Connectors** section in the sidebar of your xpander.ai dashboard.
2. Select **Datadog** with the same **connector name** you configured in the previous section (e.g., xpander-datadog).
3. Click **MCP Configuration**.
4. Enter the MCP configuration into the appropriate settings of the client app you want to use (e.g., Cursor, Windsurf, Claude Desktop, etc.).
 ## AI Agent Datadog Prompt Library
Below are possible prompts or use cases you can try after integrating Datadog into your xpander AI agent:
```
Could you create a new dashboard for monitoring {application_name} performance metrics?
```
```
Can you set up a monitor to alert us when {service_name} latency exceeds {threshold_value} milliseconds?
```
```
Could you temporarily mute alerts for {host_name} during our scheduled maintenance window on {date}?
```
```
Could you integrate our AWS {account_name} account to monitor our EC2 and Lambda resources?
```
## Related Resources
* [Understanding Model Context Protocol (MCP)](/guides/deploy/mcp)
* [Datadog API Documentation](https://docs.datadoghq.com/api/latest/?tab=java)
## AI Agent Datadog Prompt Library
Below are possible prompts or use cases you can try after integrating Datadog into your xpander AI agent:
```
Could you create a new dashboard for monitoring {application_name} performance metrics?
```
```
Can you set up a monitor to alert us when {service_name} latency exceeds {threshold_value} milliseconds?
```
```
Could you temporarily mute alerts for {host_name} during our scheduled maintenance window on {date}?
```
```
Could you integrate our AWS {account_name} account to monitor our EC2 and Lambda resources?
```
## Related Resources
* [Understanding Model Context Protocol (MCP)](/guides/deploy/mcp)
* [Datadog API Documentation](https://docs.datadoghq.com/api/latest/?tab=java)