> ## Documentation Index
> Fetch the complete documentation index at: https://docs.xpander.ai/llms.txt
> Use this file to discover all available pages before exploring further.
# Task Monitoring
> Scan executions by status, triage failures across agents, and cross-reference tasks to threads for debugging.
The Tasks tab shows every individual execution as a flat list. Use it to scan for failures, spot patterns across runs, and find specific executions by status or timestamp. For detailed debugging, switch to [Threads](/guides/observability/threads) to trace the full execution log.
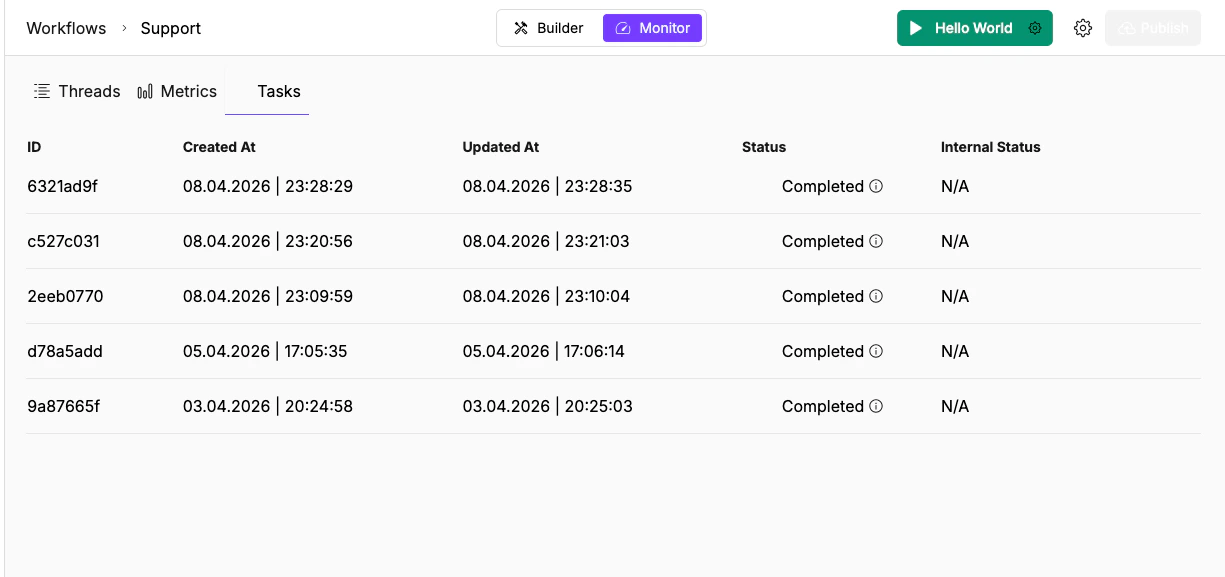 ## Task table columns
| Column | Description |
| ------------------- | ---------------------------------------------------------- |
| **ID** | Task UUID (truncated to 8 characters in the UI) |
| **Created At** | When the execution started |
| **Updated At** | When the status last changed |
| **Status** | Completed, Stopped, or Running |
| **Internal Status** | Internal execution state used for system-level diagnostics |
## Task statuses
| Status | What it means | What to do |
| ------------- | ------------------------------------------------------------------------------------------ | ------------------------------------------------------------------------------------------------------------------------------- |
| **Completed** | The execution finished successfully | No action needed. Click through to verify output quality if needed. |
| **Running** | The execution is currently in progress | Wait for completion. If it's been running unusually long compared to similar tasks, the agent may be stuck in a tool-call loop. |
| **Stopped** | The execution was interrupted: a timeout, a manual cancellation, or an unrecoverable error | Cross-reference the task ID in [Threads](/guides/observability/threads) to see the execution log and find where it stopped. |
## Tasks vs. Threads
Use Tasks when you're triaging across many runs (scanning for failures, checking completion rates). Use Threads when you need to debug a single run in depth (reading payloads, tracing tool calls).
A single thread (conversation) can contain multiple tasks. Each task is one invocation of the agent or workflow, but tasks in the same thread share conversation context through `session_id`.
```text theme={"dark"}
Thread: 6ebc5351 (session_id)
├── Task: 6ebc5351 (20:34:44 - 20:35:13) Completed
├── Task: 80632cde (20:01:22 - 20:01:25) Completed
└── Task: 179873c (19:59:44 - 20:00:01) Completed
```
To see the full execution log for a task, switch to the **Threads** tab and click into the parent thread.
## Global Tasks page
The sidebar has a dedicated **Tasks** page (the checklist icon) that shows tasks across all agents. Same columns, but with an additional **Agent Name** column so you can see which agent each task belongs to.
Use the global view when you need to triage failures across your entire workspace rather than one agent at a time.
## Triage failures
When you notice a cluster of Stopped tasks:
1. Open the global Tasks page to see executions across all agents
2. Scan by Status for clusters of Stopped tasks
3. Note whether failures are concentrated on a specific date, time, or agent
4. Click a Stopped task to get its task ID
5. Switch to the agent's [Threads](/guides/observability/threads) view and find the parent thread
6. Open the execution log and look for the last successful step before the failure
**Tasks for health checks:** Scan the global Tasks page periodically. A healthy agent should show mostly Completed tasks. A growing ratio of Stopped tasks signals a configuration issue, a broken connector, or an upstream API problem.
## What's next
Trace the full execution log to find where a run went wrong.
Spot anomalies in request volume and token usage before diving into individual threads.
## Task table columns
| Column | Description |
| ------------------- | ---------------------------------------------------------- |
| **ID** | Task UUID (truncated to 8 characters in the UI) |
| **Created At** | When the execution started |
| **Updated At** | When the status last changed |
| **Status** | Completed, Stopped, or Running |
| **Internal Status** | Internal execution state used for system-level diagnostics |
## Task statuses
| Status | What it means | What to do |
| ------------- | ------------------------------------------------------------------------------------------ | ------------------------------------------------------------------------------------------------------------------------------- |
| **Completed** | The execution finished successfully | No action needed. Click through to verify output quality if needed. |
| **Running** | The execution is currently in progress | Wait for completion. If it's been running unusually long compared to similar tasks, the agent may be stuck in a tool-call loop. |
| **Stopped** | The execution was interrupted: a timeout, a manual cancellation, or an unrecoverable error | Cross-reference the task ID in [Threads](/guides/observability/threads) to see the execution log and find where it stopped. |
## Tasks vs. Threads
Use Tasks when you're triaging across many runs (scanning for failures, checking completion rates). Use Threads when you need to debug a single run in depth (reading payloads, tracing tool calls).
A single thread (conversation) can contain multiple tasks. Each task is one invocation of the agent or workflow, but tasks in the same thread share conversation context through `session_id`.
```text theme={"dark"}
Thread: 6ebc5351 (session_id)
├── Task: 6ebc5351 (20:34:44 - 20:35:13) Completed
├── Task: 80632cde (20:01:22 - 20:01:25) Completed
└── Task: 179873c (19:59:44 - 20:00:01) Completed
```
To see the full execution log for a task, switch to the **Threads** tab and click into the parent thread.
## Global Tasks page
The sidebar has a dedicated **Tasks** page (the checklist icon) that shows tasks across all agents. Same columns, but with an additional **Agent Name** column so you can see which agent each task belongs to.
Use the global view when you need to triage failures across your entire workspace rather than one agent at a time.
## Triage failures
When you notice a cluster of Stopped tasks:
1. Open the global Tasks page to see executions across all agents
2. Scan by Status for clusters of Stopped tasks
3. Note whether failures are concentrated on a specific date, time, or agent
4. Click a Stopped task to get its task ID
5. Switch to the agent's [Threads](/guides/observability/threads) view and find the parent thread
6. Open the execution log and look for the last successful step before the failure
**Tasks for health checks:** Scan the global Tasks page periodically. A healthy agent should show mostly Completed tasks. A growing ratio of Stopped tasks signals a configuration issue, a broken connector, or an upstream API problem.
## What's next
Trace the full execution log to find where a run went wrong.
Spot anomalies in request volume and token usage before diving into individual threads.