> ## Documentation Index
> Fetch the complete documentation index at: https://docs.xpander.ai/llms.txt
> Use this file to discover all available pages before exploring further.
# Threads View
> Trace what happened in any agent or workflow run: every input, tool call, and response in order.
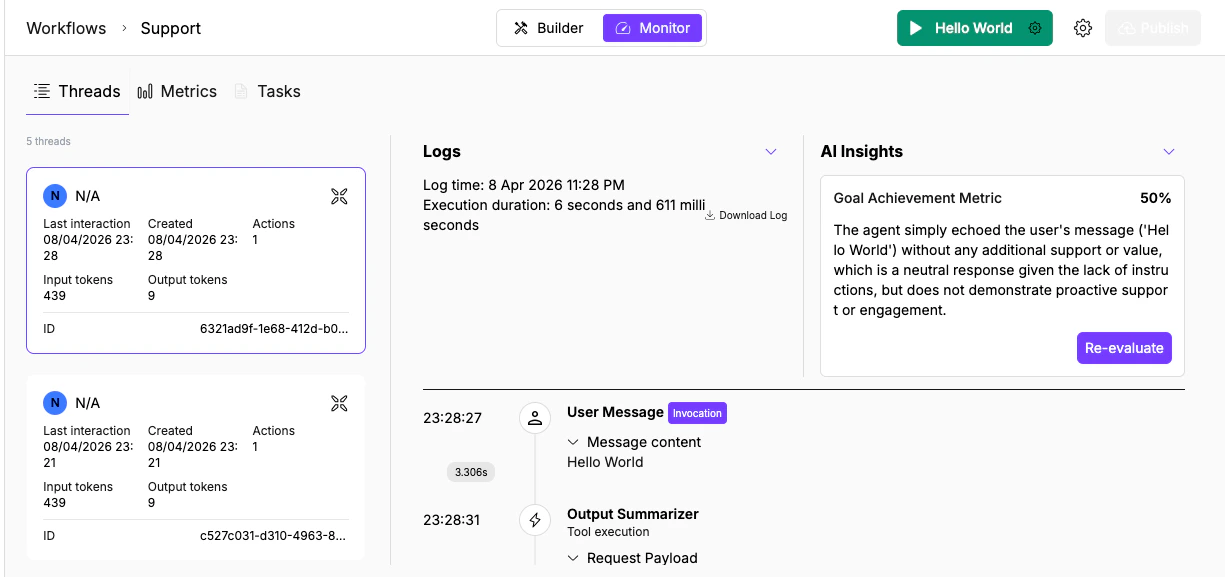
When an agent returns an unexpected answer or a workflow produces the wrong output, the Threads view is where you trace what happened. Each thread reconstructs the full execution step by step: what went in, what each node did, and what came out.
## Thread list
The left panel lists all threads with key metadata at a glance:
* **User** (name or "N/A" for anonymous/API triggers)
* **Last interaction** and **Created** timestamps
* **Actions** count (tool calls and processing steps)
* **Input/Output tokens**
* **Cost**
* **Thread ID** (UUID)
Click any thread to open its execution log on the right.
 ## Execution log
When you select a thread, the **Logs** panel on the right reconstructs the full execution step by step.
The header shows the **log time** and **execution duration** (down to milliseconds). Below it, each step appears in order with a timestamp and expandable sections:
| Event type | What it shows | What to check |
| ------------------------------------------------- | ---------------------------------------------------- | ------------------------------------------------------------------------------------------------------------------------------- |
| **User Message** \[Invocation] | The input that started the run | Was the input what you expected? Garbled webhook payloads or truncated messages cause downstream failures. |
| **Tool/Node execution** (e.g., Output Summarizer) | A processing step with request and response payloads | Expand **Request Payload** to verify the right data was sent. Expand **Response** to check for error messages or empty results. |
| **Agent Final Response** | The output returned to the user | Compare against what you expected. If wrong, trace backwards through the tool calls above to find where it diverged. |
Controls at the top of the log:
* **Expand All / Collapse All** toggles all expandable sections
* **Download Log** exports the thread as a JSON file with every message, tool call, and payload
* **Expand** opens the log panel fullscreen
## Trace a problem
When something goes wrong, use the execution log to find where the output diverged from what you expected:
1. Open Threads and find the conversation by timestamp or user name
2. Click into the thread to open the execution log
3. Walk through tool calls in order. For each one, expand **Request Payload** to verify the right data was sent and **Response** to check what came back.
4. Find the step where the output stopped matching expectations.
5. If the tool response was correct but the final answer was wrong, the issue is in the agent's instructions (it misinterpreted the data). If the tool response itself was wrong, the issue is upstream: wrong parameters, missing permissions, or stale data.
**Download for offline analysis:** Click **Download Log** to export the full thread as JSON. This includes every message, tool call payload, and response, useful for sharing with teammates or comparing runs side by side.
## AI Insights
Click **Evaluate** in the AI Insights panel (right side) to run an automated quality assessment on the thread.
## Execution log
When you select a thread, the **Logs** panel on the right reconstructs the full execution step by step.
The header shows the **log time** and **execution duration** (down to milliseconds). Below it, each step appears in order with a timestamp and expandable sections:
| Event type | What it shows | What to check |
| ------------------------------------------------- | ---------------------------------------------------- | ------------------------------------------------------------------------------------------------------------------------------- |
| **User Message** \[Invocation] | The input that started the run | Was the input what you expected? Garbled webhook payloads or truncated messages cause downstream failures. |
| **Tool/Node execution** (e.g., Output Summarizer) | A processing step with request and response payloads | Expand **Request Payload** to verify the right data was sent. Expand **Response** to check for error messages or empty results. |
| **Agent Final Response** | The output returned to the user | Compare against what you expected. If wrong, trace backwards through the tool calls above to find where it diverged. |
Controls at the top of the log:
* **Expand All / Collapse All** toggles all expandable sections
* **Download Log** exports the thread as a JSON file with every message, tool call, and payload
* **Expand** opens the log panel fullscreen
## Trace a problem
When something goes wrong, use the execution log to find where the output diverged from what you expected:
1. Open Threads and find the conversation by timestamp or user name
2. Click into the thread to open the execution log
3. Walk through tool calls in order. For each one, expand **Request Payload** to verify the right data was sent and **Response** to check what came back.
4. Find the step where the output stopped matching expectations.
5. If the tool response was correct but the final answer was wrong, the issue is in the agent's instructions (it misinterpreted the data). If the tool response itself was wrong, the issue is upstream: wrong parameters, missing permissions, or stale data.
**Download for offline analysis:** Click **Download Log** to export the full thread as JSON. This includes every message, tool call payload, and response, useful for sharing with teammates or comparing runs side by side.
## AI Insights
Click **Evaluate** in the AI Insights panel (right side) to run an automated quality assessment on the thread.
 The evaluation produces:
* **Goal Achievement Metric** (percentage score): measures how well the agent accomplished what its instructions describe. Below 50% usually means the agent missed a key step or produced incorrect output. Above 80% means the core task was handled correctly.
* **Text assessment**: a written analysis of what the agent did well and where it fell short. Read this to understand which specific steps contributed to or hurt the score.
Click **Re-evaluate** after changing the agent's instructions or tools to see if the score improves. This is the fastest way to validate a fix without re-running production traffic.
## What's next
Scan executions by status and triage failures across agents.
Spot anomalies in request volume and token usage before diving into individual threads.
The evaluation produces:
* **Goal Achievement Metric** (percentage score): measures how well the agent accomplished what its instructions describe. Below 50% usually means the agent missed a key step or produced incorrect output. Above 80% means the core task was handled correctly.
* **Text assessment**: a written analysis of what the agent did well and where it fell short. Read this to understand which specific steps contributed to or hurt the score.
Click **Re-evaluate** after changing the agent's instructions or tools to see if the score improves. This is the fastest way to validate a fix without re-running production traffic.
## What's next
Scan executions by status and triage failures across agents.
Spot anomalies in request volume and token usage before diving into individual threads.