AI Agent Workbench
Agent Graph System (AGS)
Learn how to create hierarchical constraints for your agents using the Agent Graph System
What is the Agent Graph System?
The Agent Graph System (AGS) lets you define hierarchical constraints for your AI agents, controlling which operations they can use and in what order.While agents can see all available operations, they must follow the workflow you define. This balances autonomy with predictable behavior.
When to use AGS
When to use AGS
- When your agent needs to follow a specific workflow with dependencies
- To prevent the agent from skipping important steps
- To enforce logical progression in data collection
- When building complex agents with multiple tools
- To guide the agent without overly restrictive instructions
Core Concepts
An agent graph consists of three simple components:- Nodes - Individual operations (tools) your agent can use
- Connections - Define which operations must happen before others
- Hierarchical levels - Group operations by their position in the workflow
Example Agent Workflow that requires AGS
Let’s explore a practical example of an agent that needs to follow a specific workflow: Users might ask the agent to research a specific topic, and the agent should follow this sequence:- First, search for general information about the topic
- Once basic information is found, extract specific details
- Finally, analyze or summarize the collected information
Key Benefits
Key Benefits
- Bounded autonomy: Agents make decisions within your constraints
- Logical gatekeeping: Ensures prerequisites are met before advancing
- Reduced hallucinations: Prevents agents from making up data they should retrieve
- Workflow optimization: Creates efficient paths for multi-step tasks
- Simplified maintenance: Easier to update agent behavior by modifying the graph
Implementation Methods
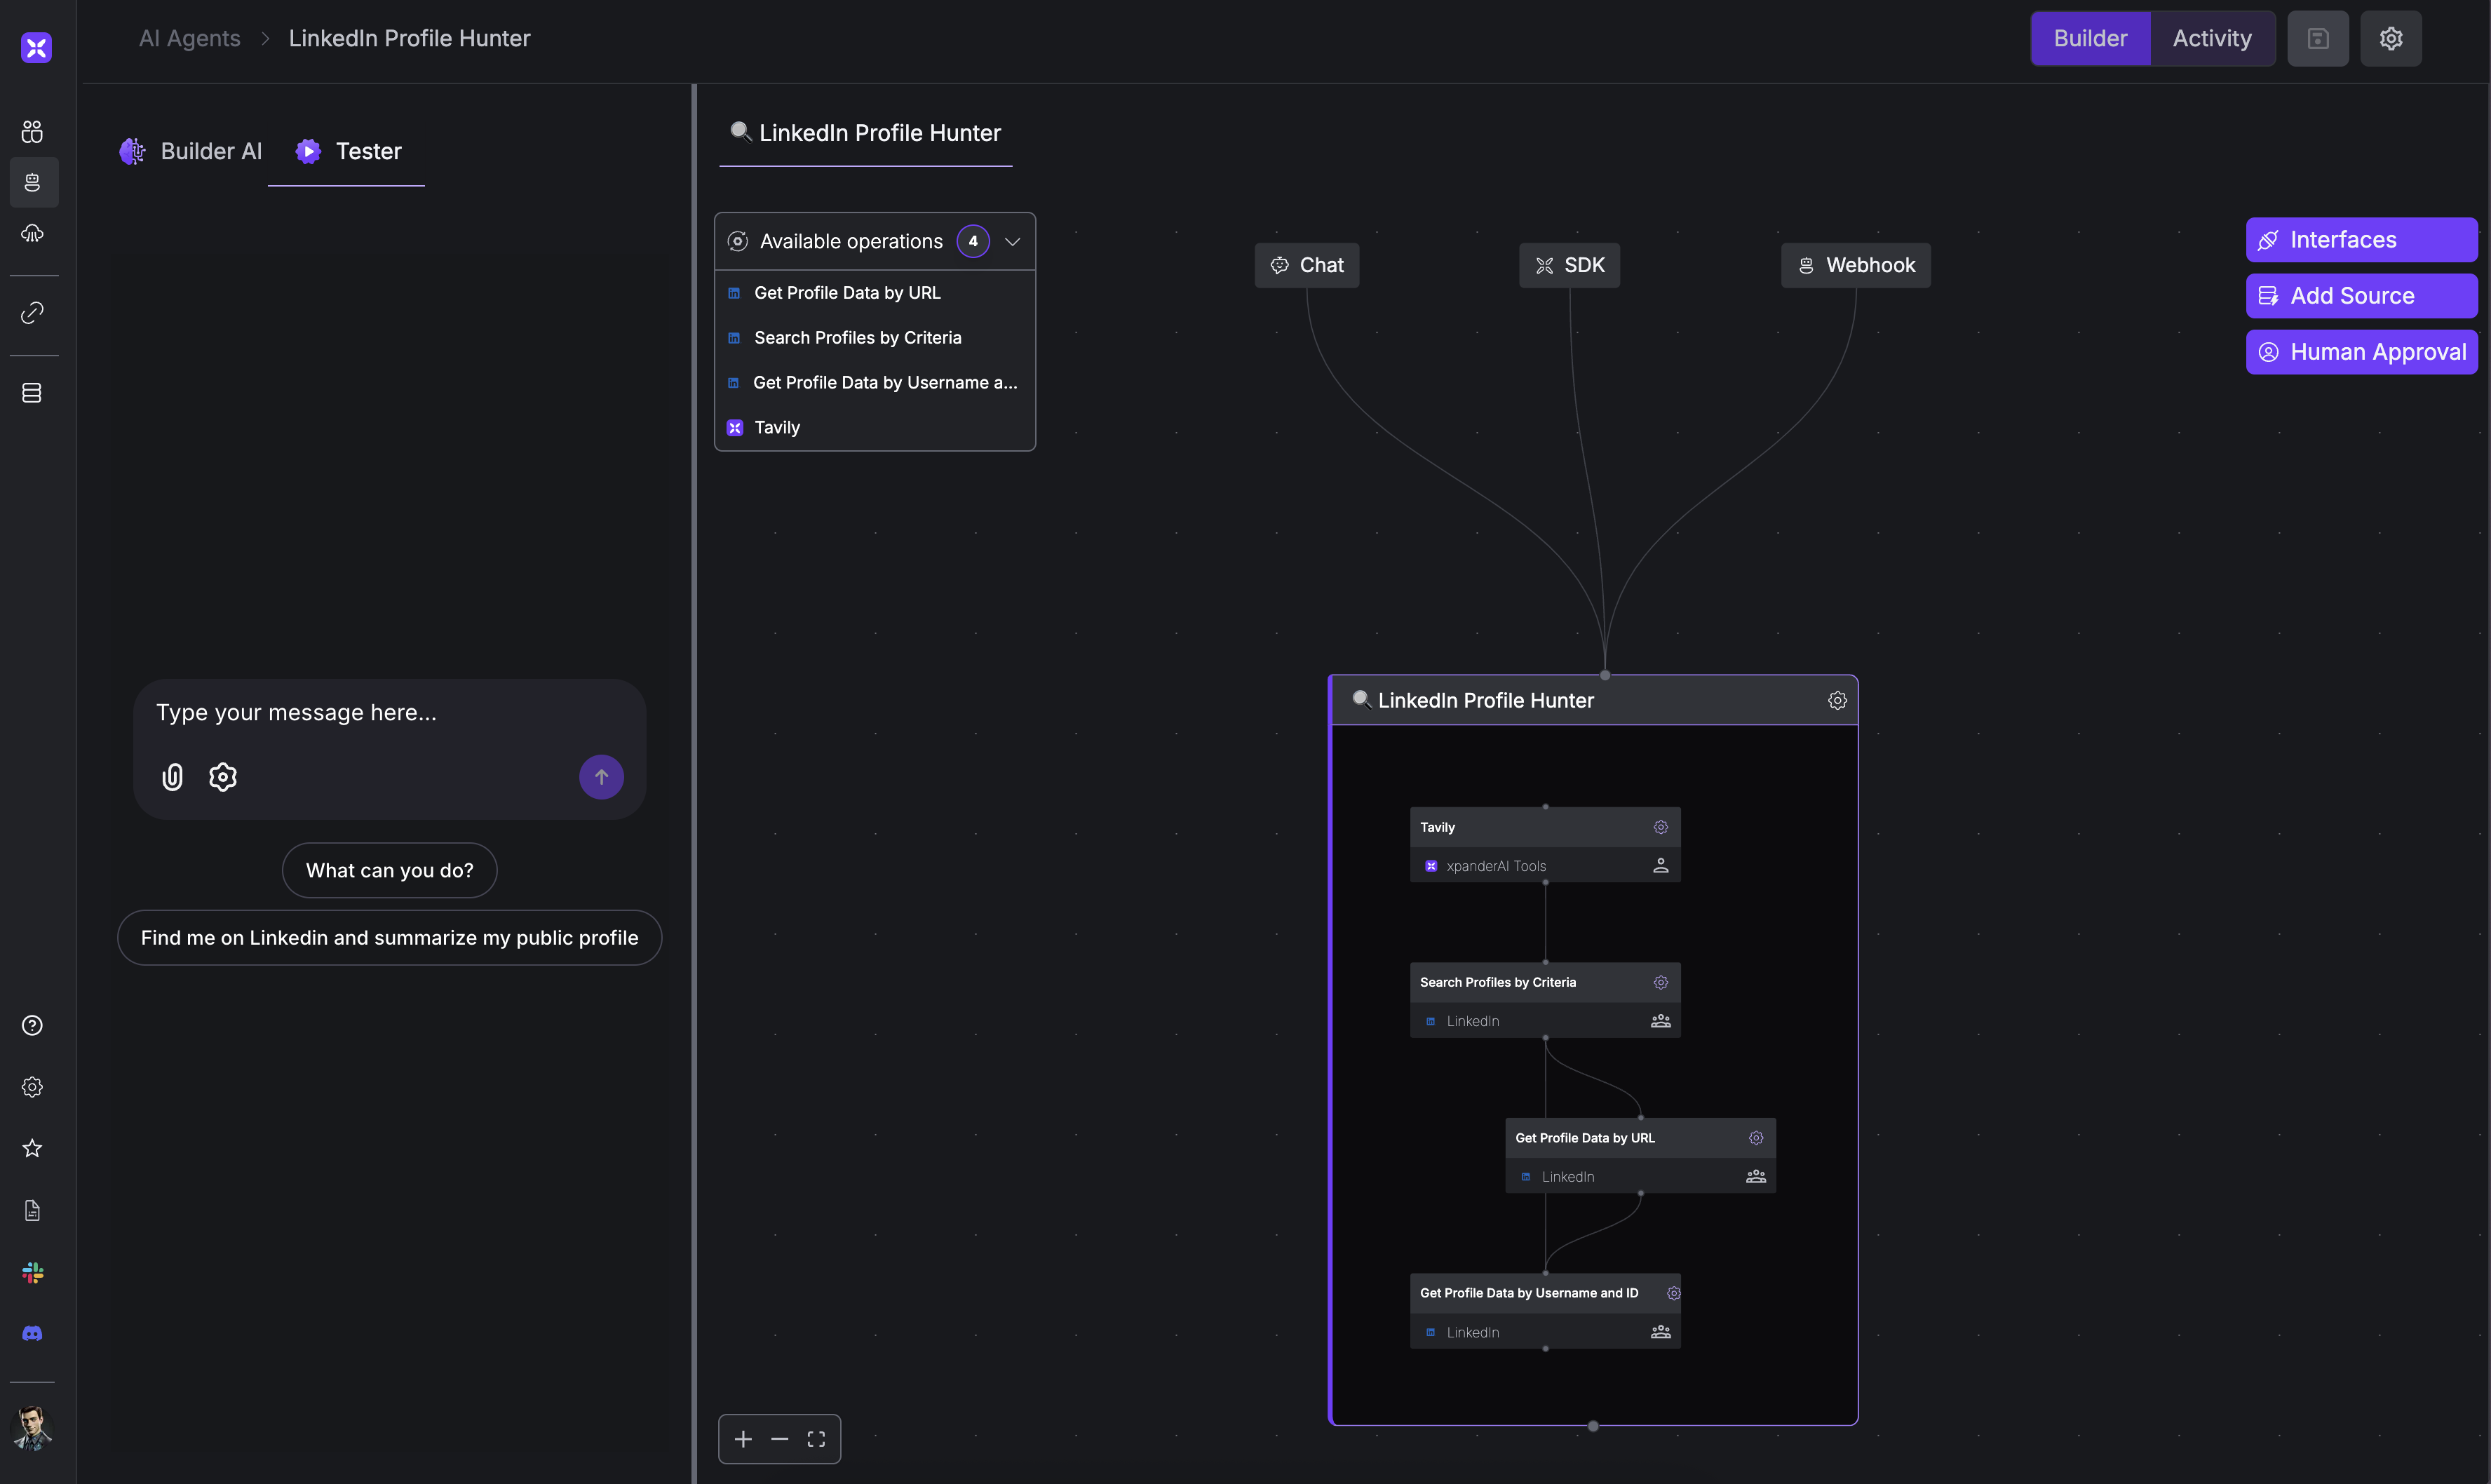
You can create agent graphs using either the visual UI or programmatically with the SDK. Both approaches offer the same functionality, with the visual builder being more intuitive for non-developers and the SDK providing more flexibility for programmers.The xpander.ai UI provides a drag-and-drop interface for creating agent graphs:
1
Access the Graph Builder
Navigate to your agent in the xpander.ai dashboard and select the “Graph” tab
2
Add Operations
Drag operations from the sidebar into your graph workspace
3
Create Connections
Draw lines between operations to establish dependencies
4
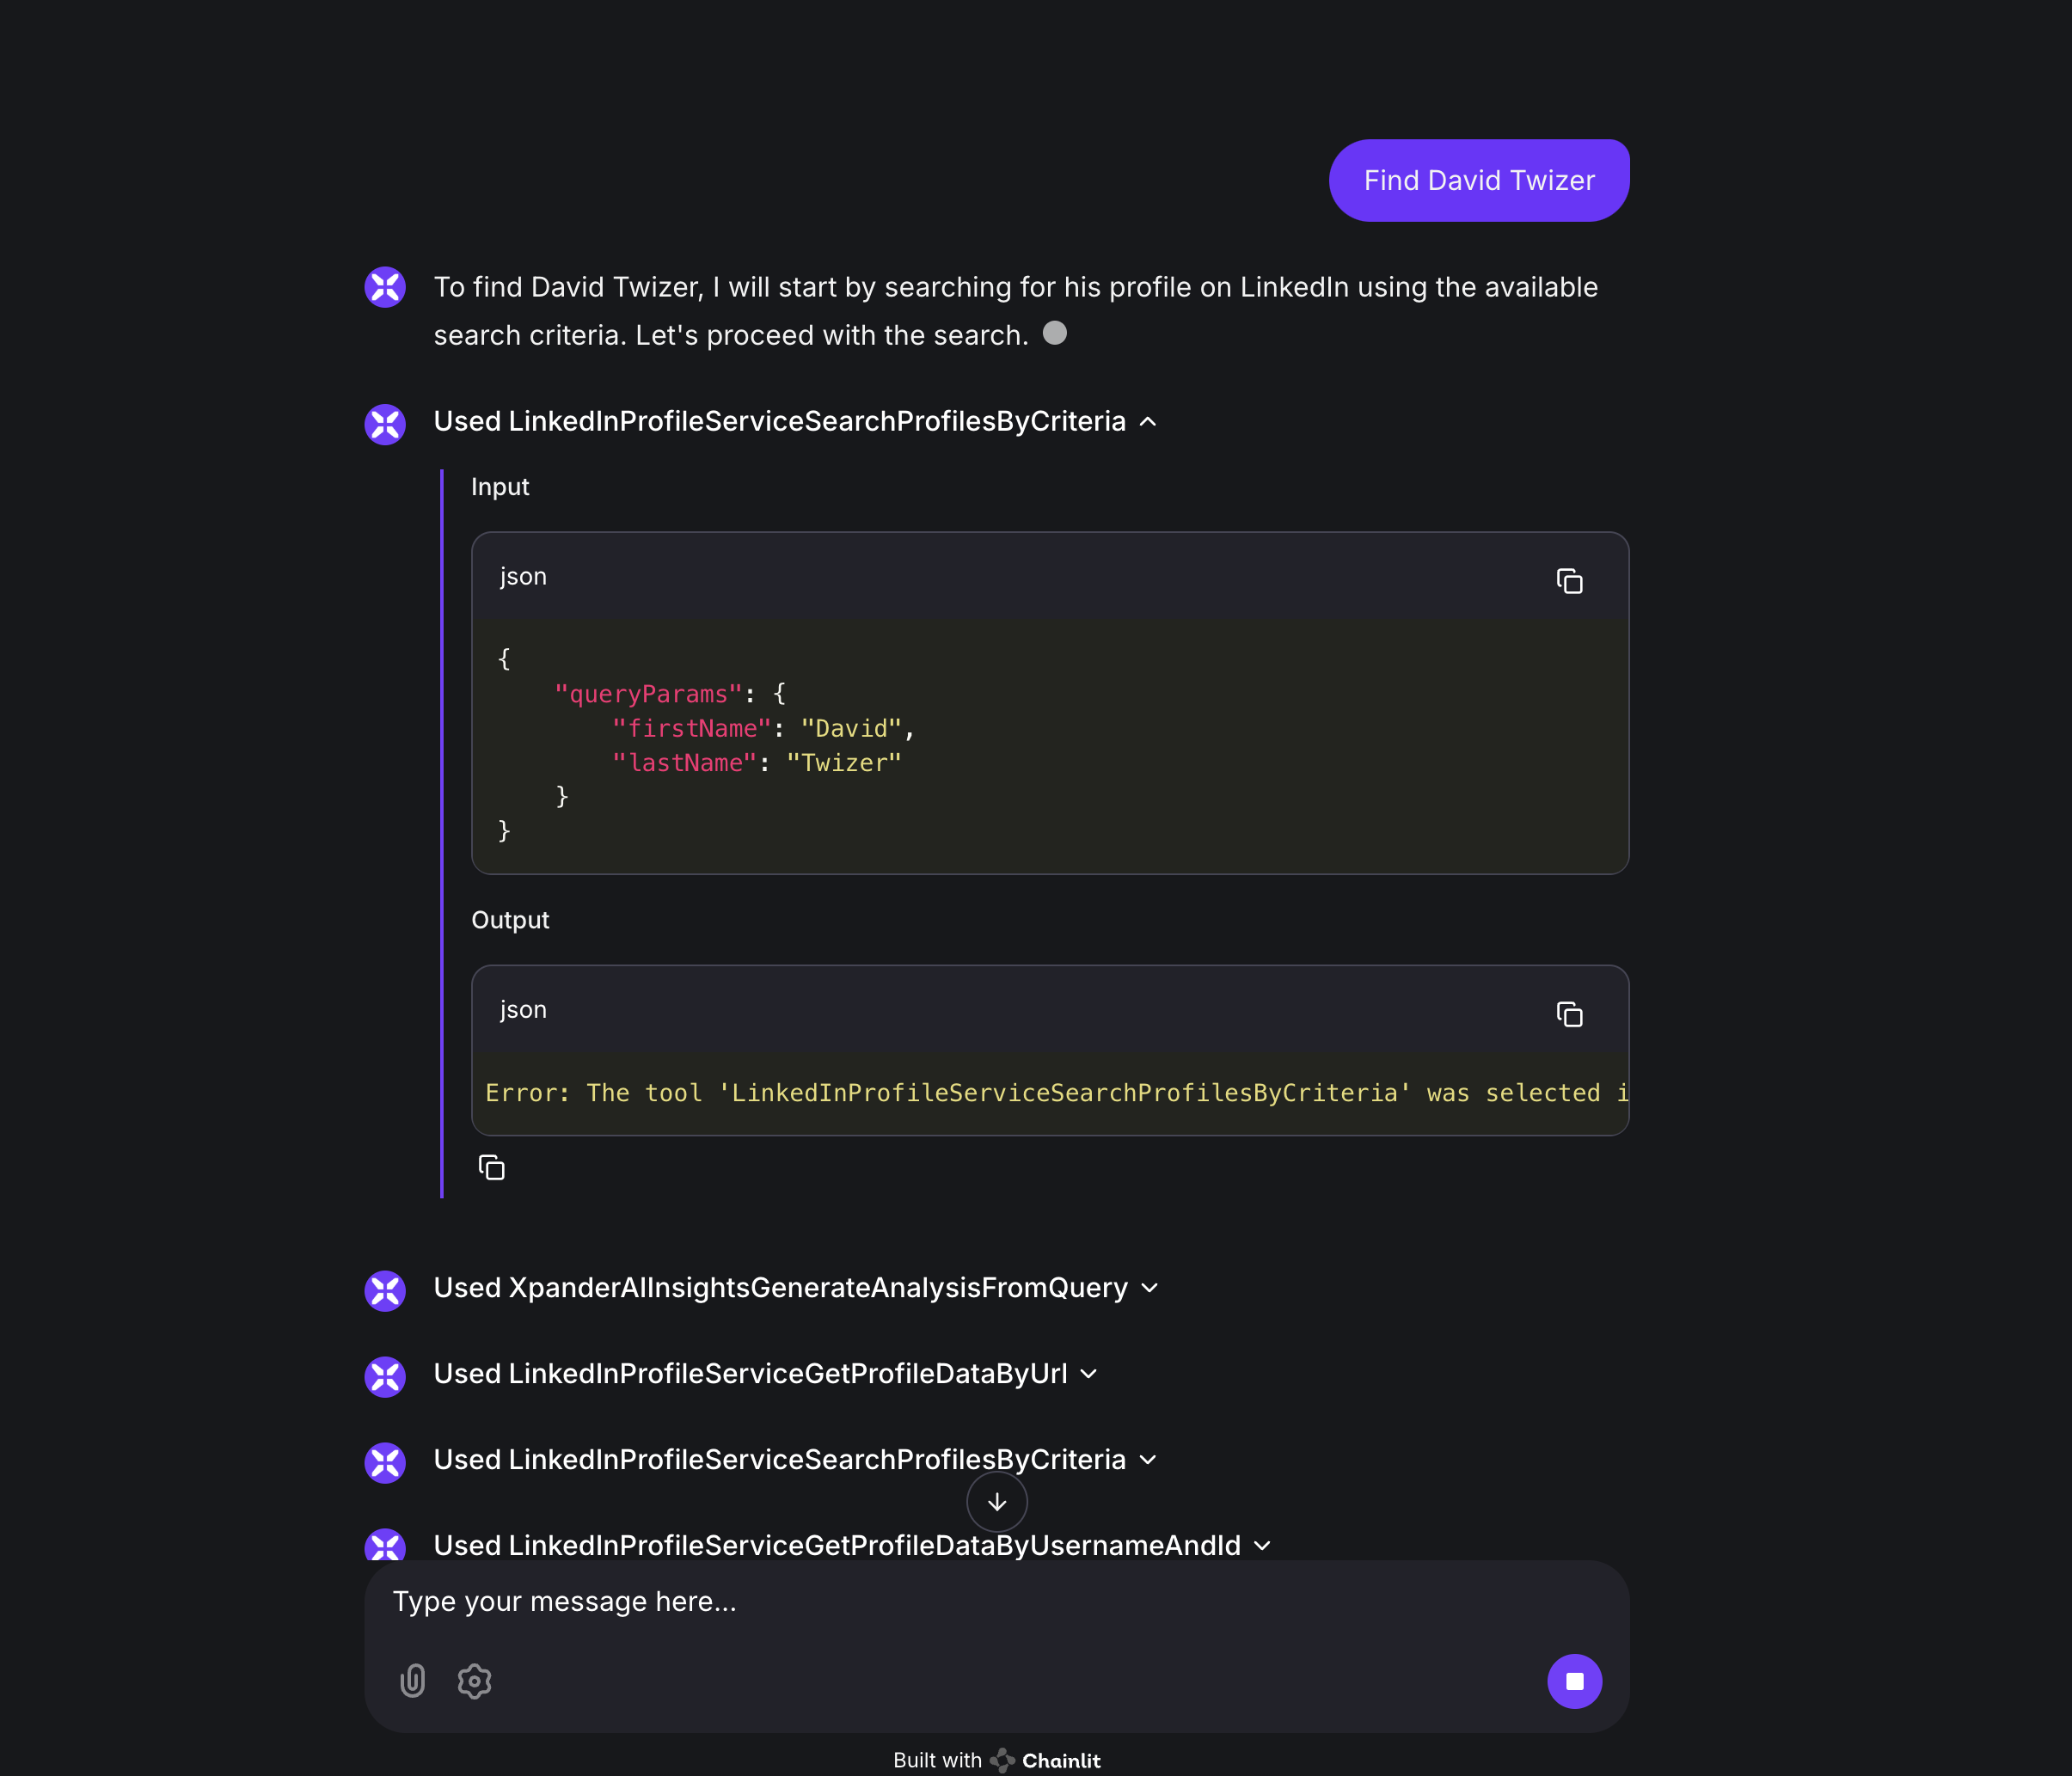
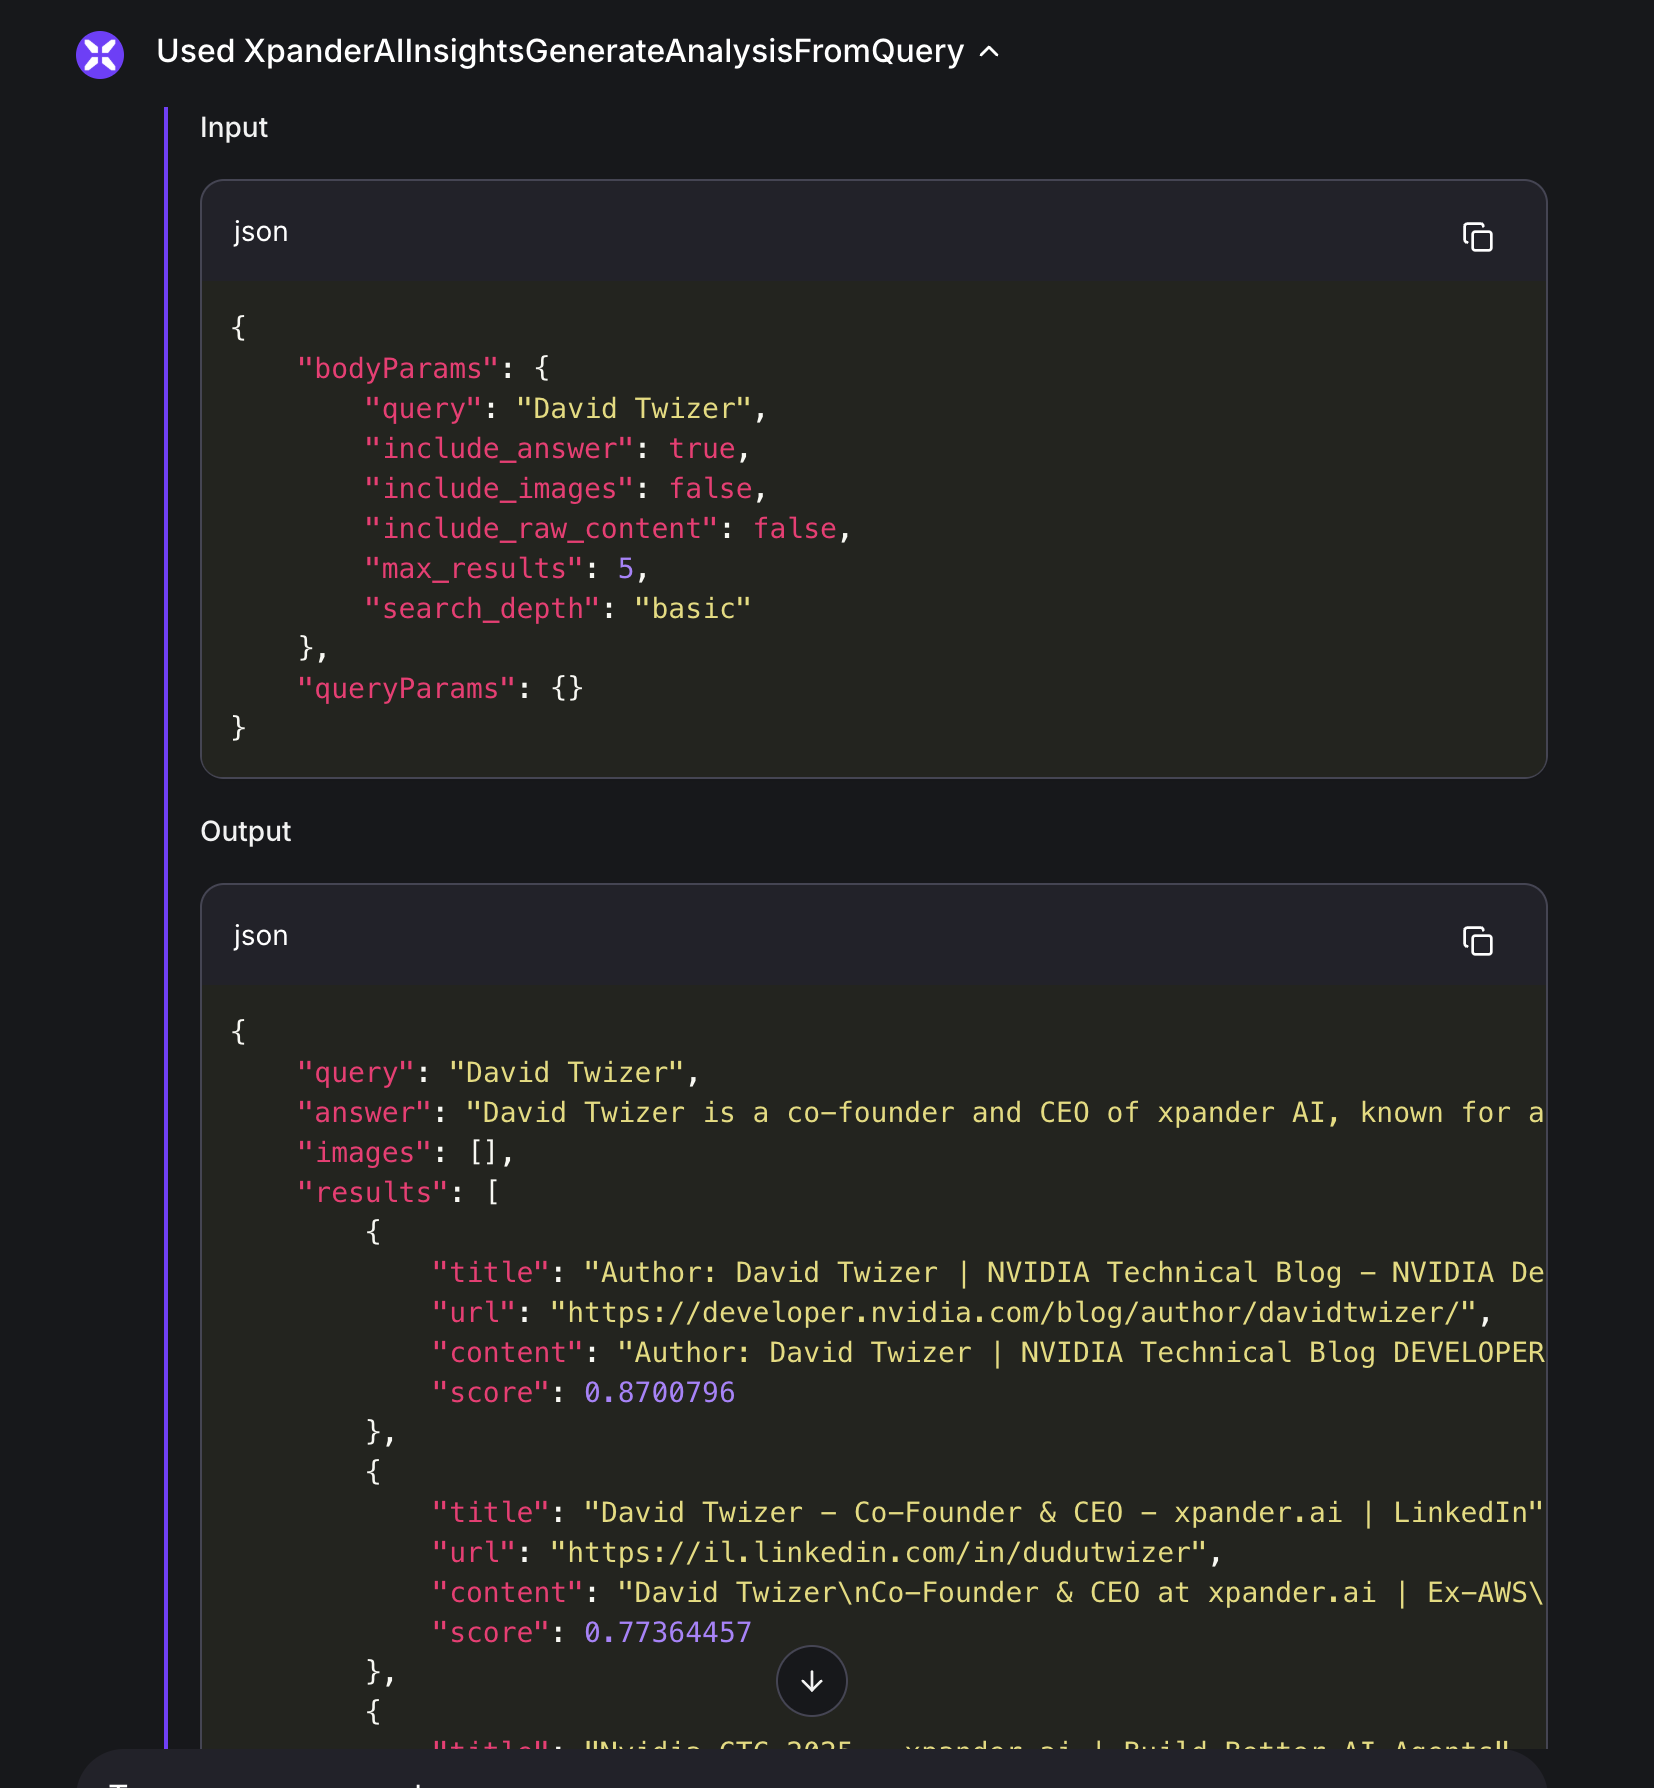
Test Your Graph
Use the interface options to test your agent with different invocation methods
5
Deploy
Save changes to deploy your updated graph
The visual builder gives you all the power of AGS without writing code, making it accessible to both developers and non-developers.
Advanced UI Techniques
Advanced UI Techniques
Multiple Prerequisites
To create operations that require multiple previous steps:- Drag all prerequisite operations into your graph
- Draw connection lines from each prerequisite to the dependent operation
- The dependent operation will only become available after all prerequisites are completed
Creating Multiple Paths
To create branching execution paths:- Add a “parent” operation (like a search operation)
- Add multiple “child” operations that can follow
- Draw connections from the parent to each possible child
- The agent can choose which path to take after completing the parent operation
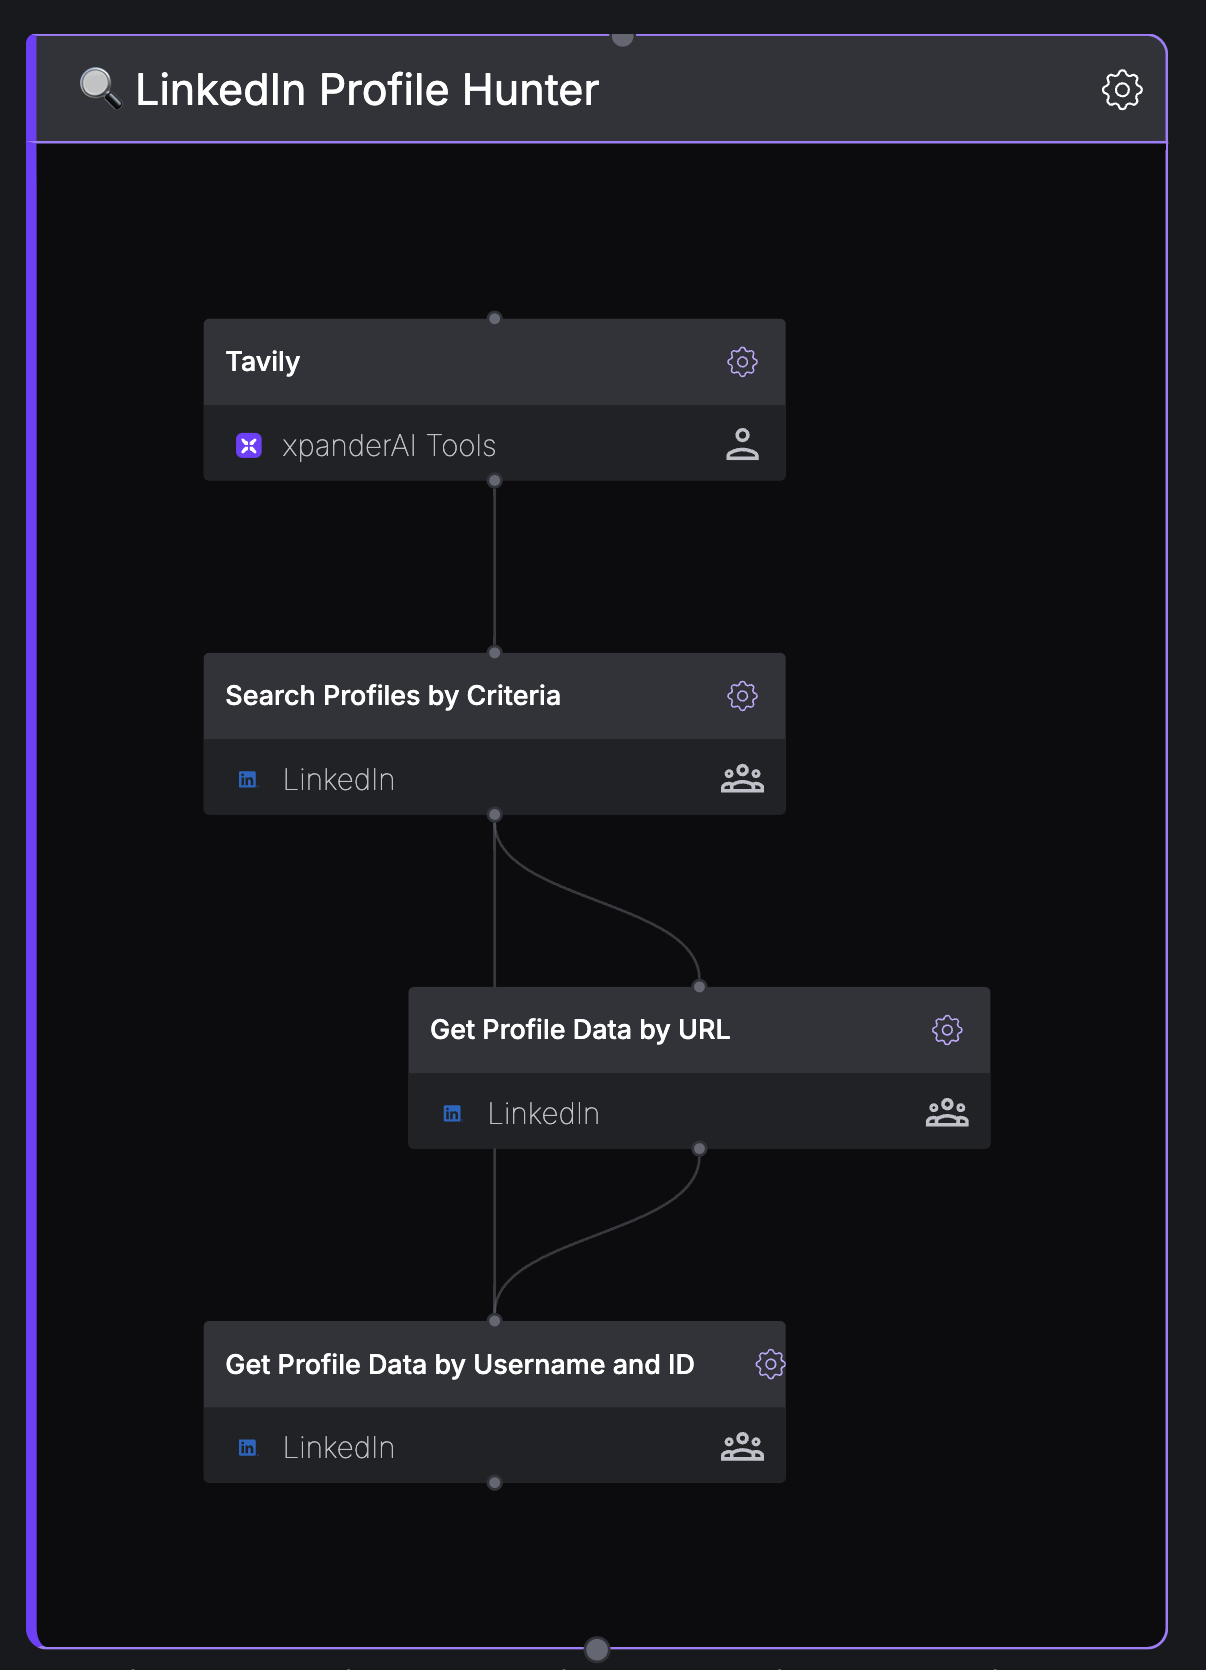
Example: Agent Structure in UI
A well-structured agent graph typically demonstrates:- Top Level: Operations that run first (initial searches, data gathering)
- Middle Level: Operations that depend on top-level results
- Bottom Level: Operations that require specific data from previous steps
Troubleshooting & Best Practices
Best Practices
Best Practices
- Start simple: Begin with basic dependencies before adding complexity
- Test incrementally: Verify each operation works before adding constraints
- Document your design: Keep track of the relationships you define
- Consider edge cases: Plan for how the agent should handle operation failures
- Balance structure and flexibility: Define necessary constraints without over-restricting
- Design for user intent: Structure workflows around common user requests
- Verify sync calls: Ensure
agent.sync()is called after every graph modification
Common Issues
Common Issues
| Problem | Solution |
|---|---|
| Agent ignores constraints | Ensure you’ve called agent.sync() after defining relationships |
| Operations unavailable | Check that all operations are properly attached to the agent |
| Circular dependencies | Look for cycles in your graph that might prevent execution |
| Unintended restrictions | Verify constraints don’t block valid execution paths |
| Changes not applied | Verify that agent.sync() is called after making graph modifications |
| Missing prerequisites | Ensure all node requirements are properly connected |