Reports
Reports are best when the agent needs to explain what happened. Use reports for summaries, reviews, briefings, findings, recommendations, and recurring updates - a morning market digest, a customer escalation summary, an AppSec findings report, a KYC review packet, an executive weekly briefing, or a compliance evidence summary.Dashboards
Dashboards are best when the result needs to be scanned or monitored. Use dashboards for metrics, trends, status, comparisons, risks, and operational views - a stock and IPO watchlist, a customer health dashboard, a data access request queue, a security review status, a budget or usage dashboard, or a sales performance summary.Components agents can generate
Agents don’t just return text - they assemble reports and dashboards from rich building blocks. The same components can be combined to fit almost any workflow. Here are some of the components an agent surface can render:Cards & summaries
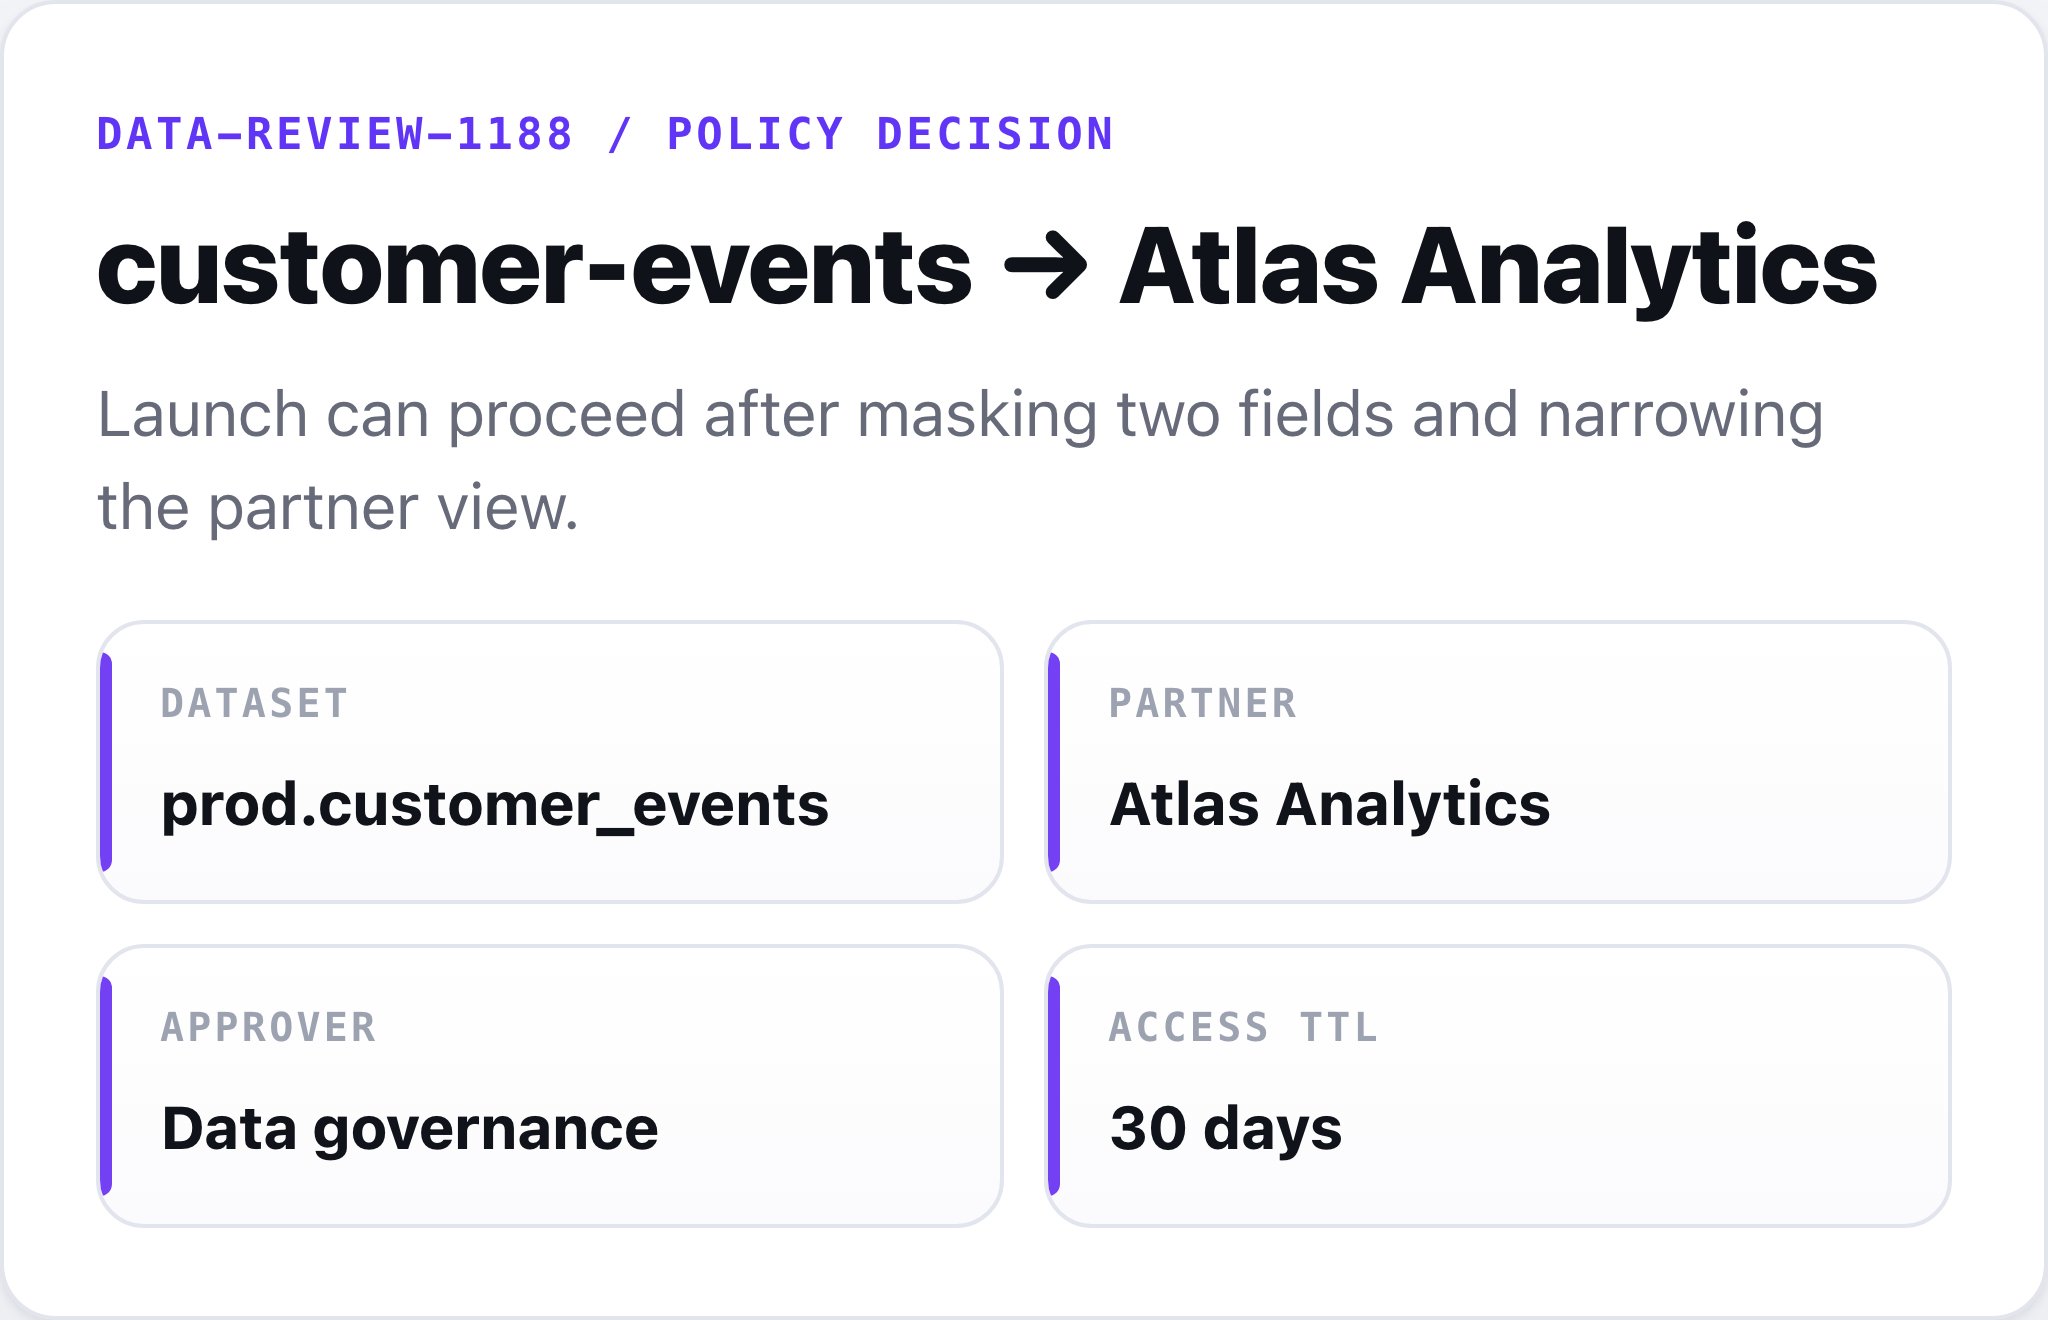
Header + brief cards
A report header with the key fields up top - dataset, owner, decision, and TTL - so the context is clear before anything else.
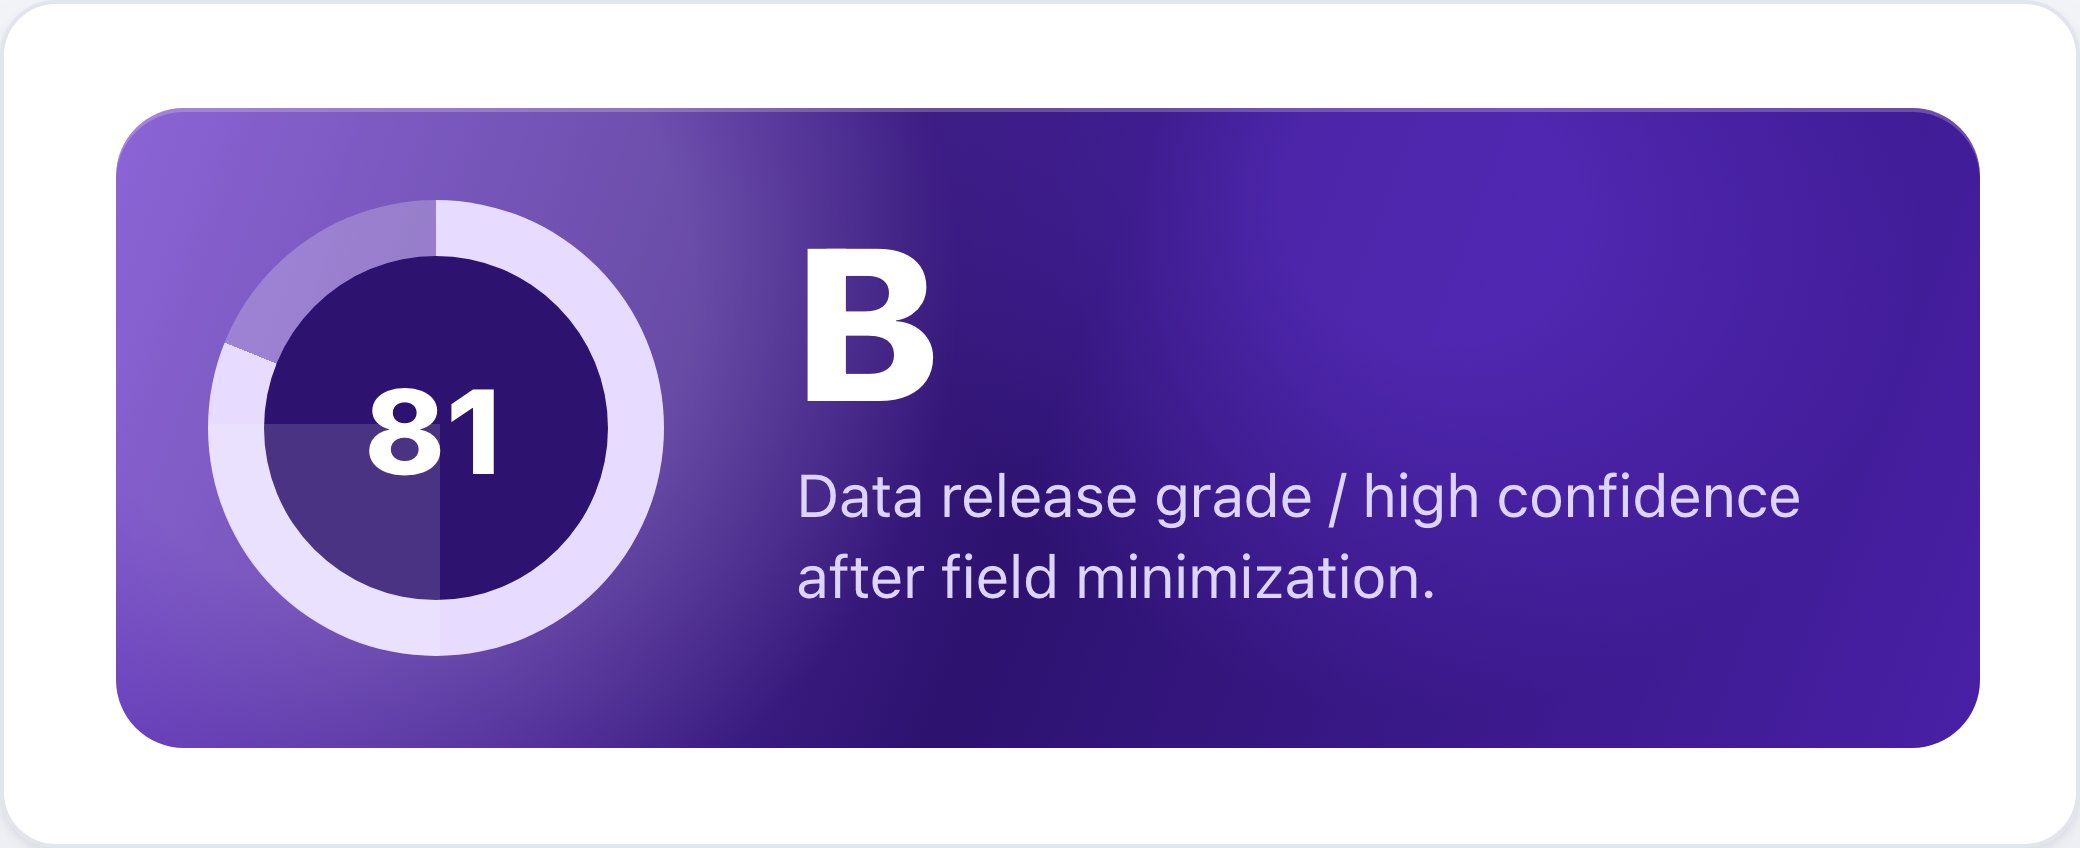
Score band + gauge
A headline score or grade with a gauge, summarizing the agent’s overall assessment.
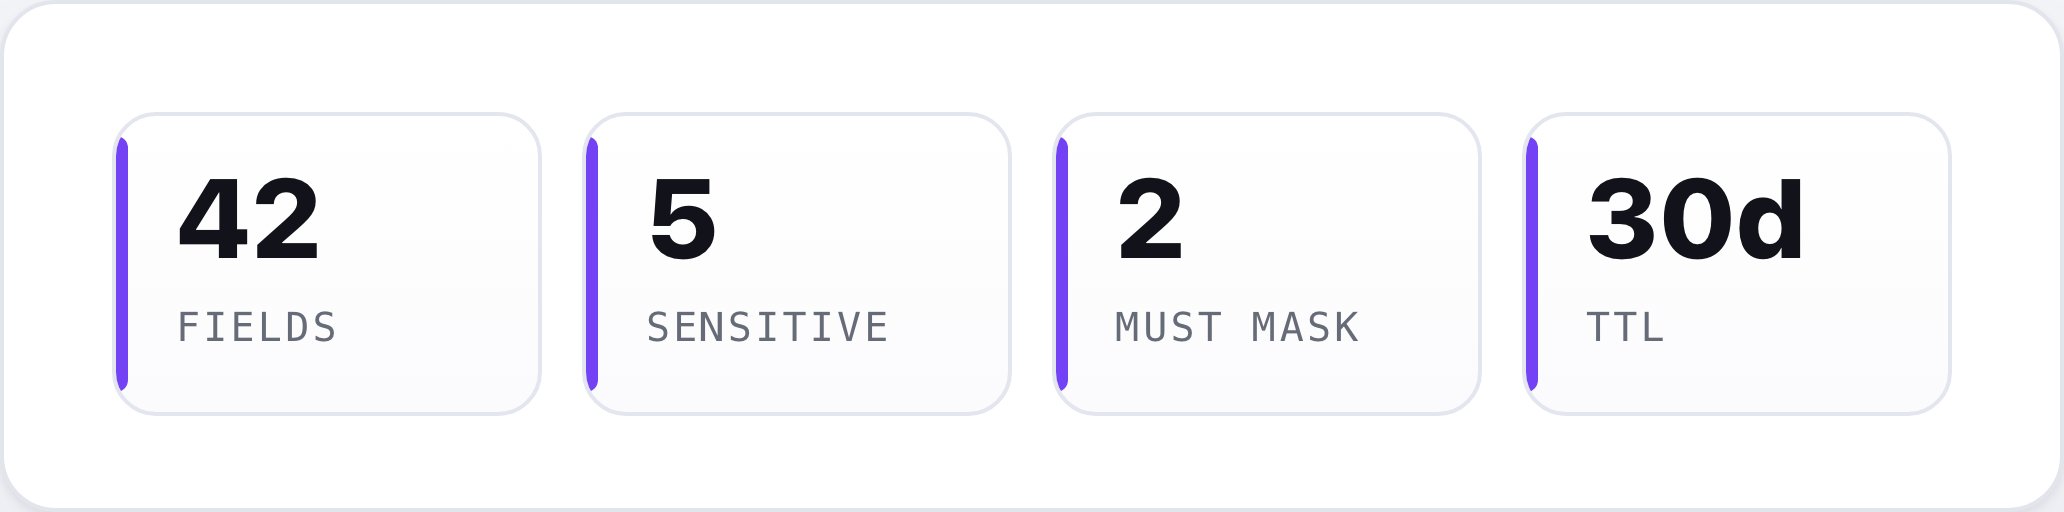
Metric grid
A row of KPI tiles surfacing the numbers that matter at a glance.
Charts
Donut + legend
A proportion view with a legend - how items split across categories or risk levels.
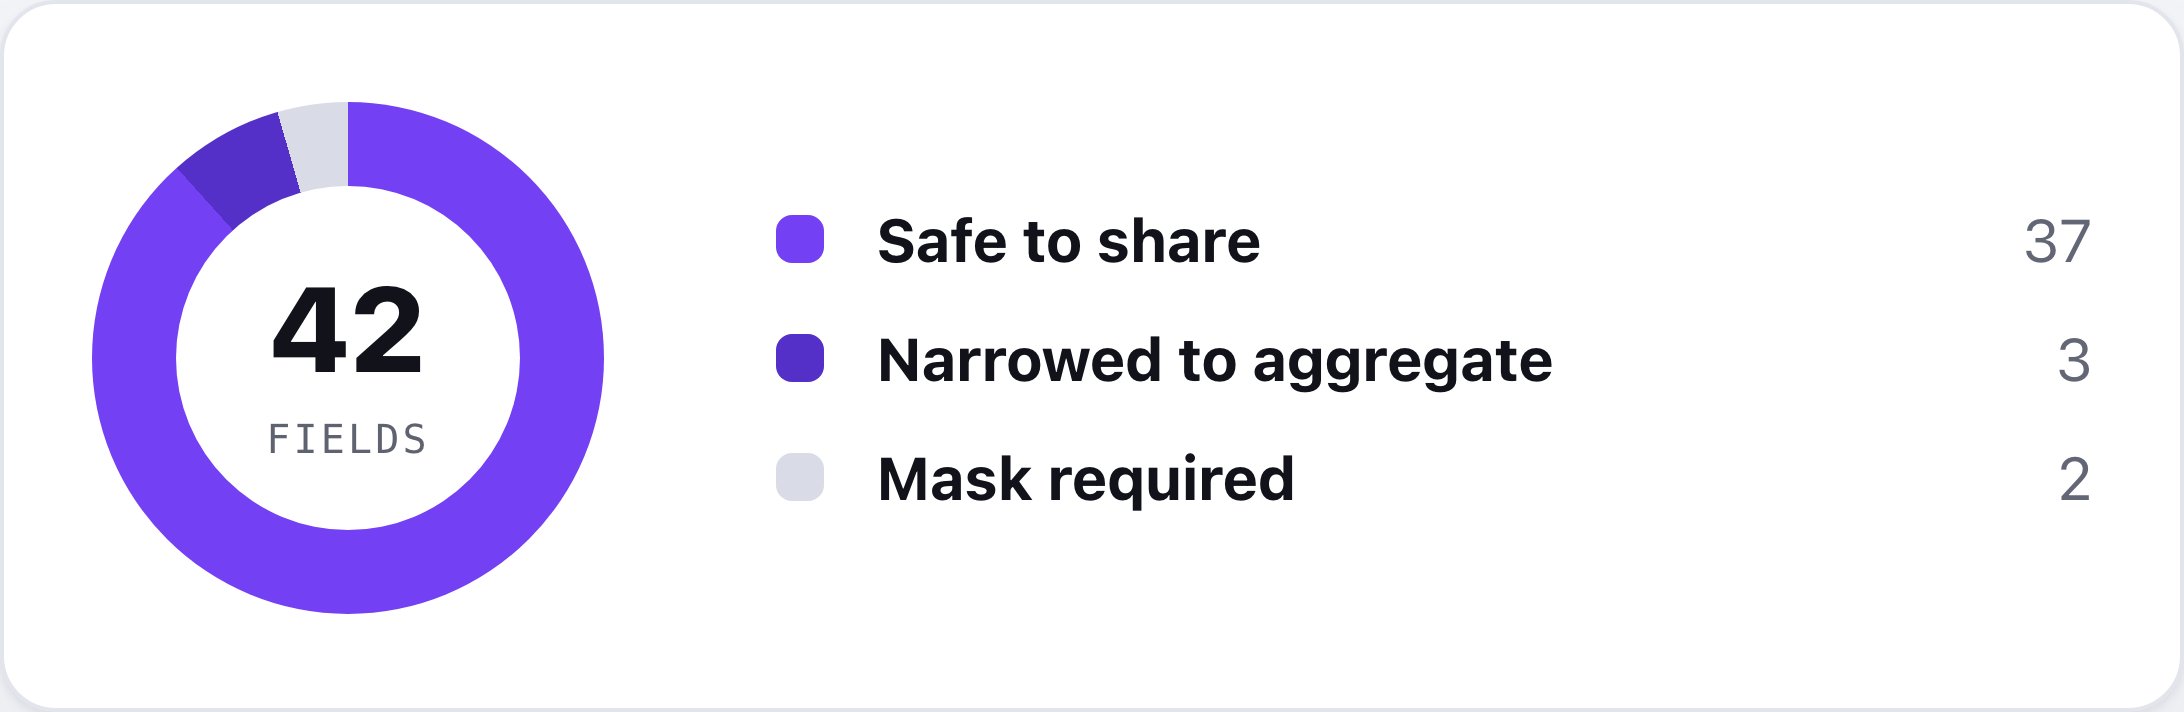
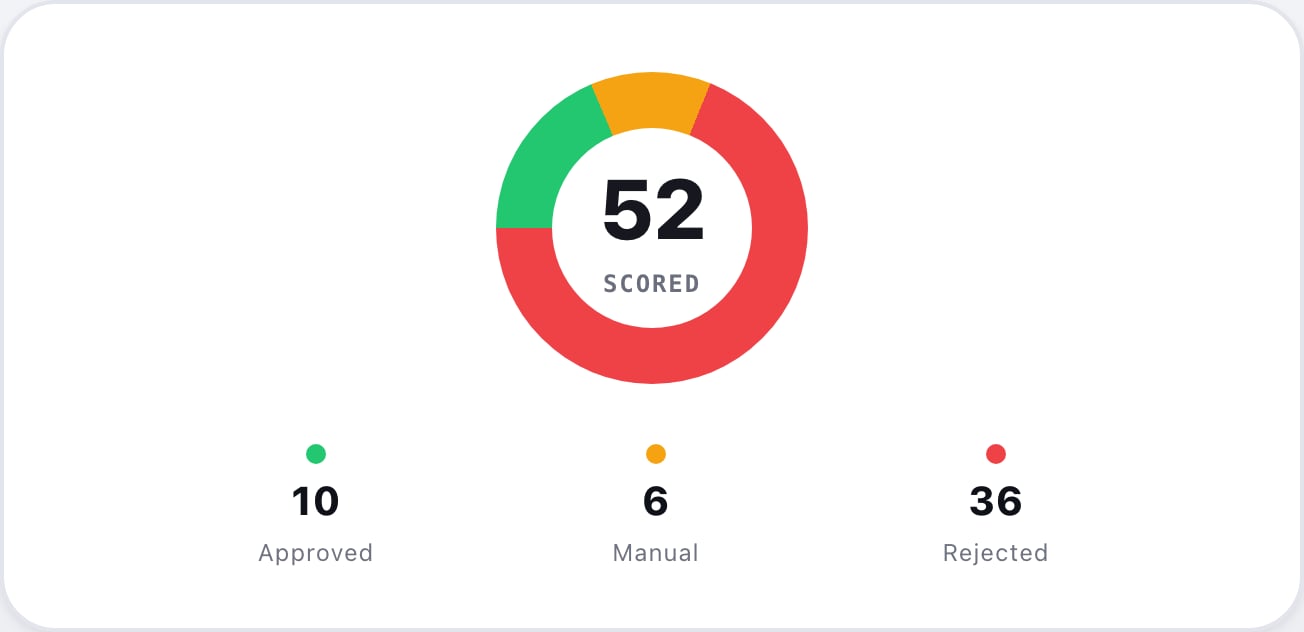
Segmented donut
A scored breakdown across segments - for example, approved vs. manual vs. rejected.
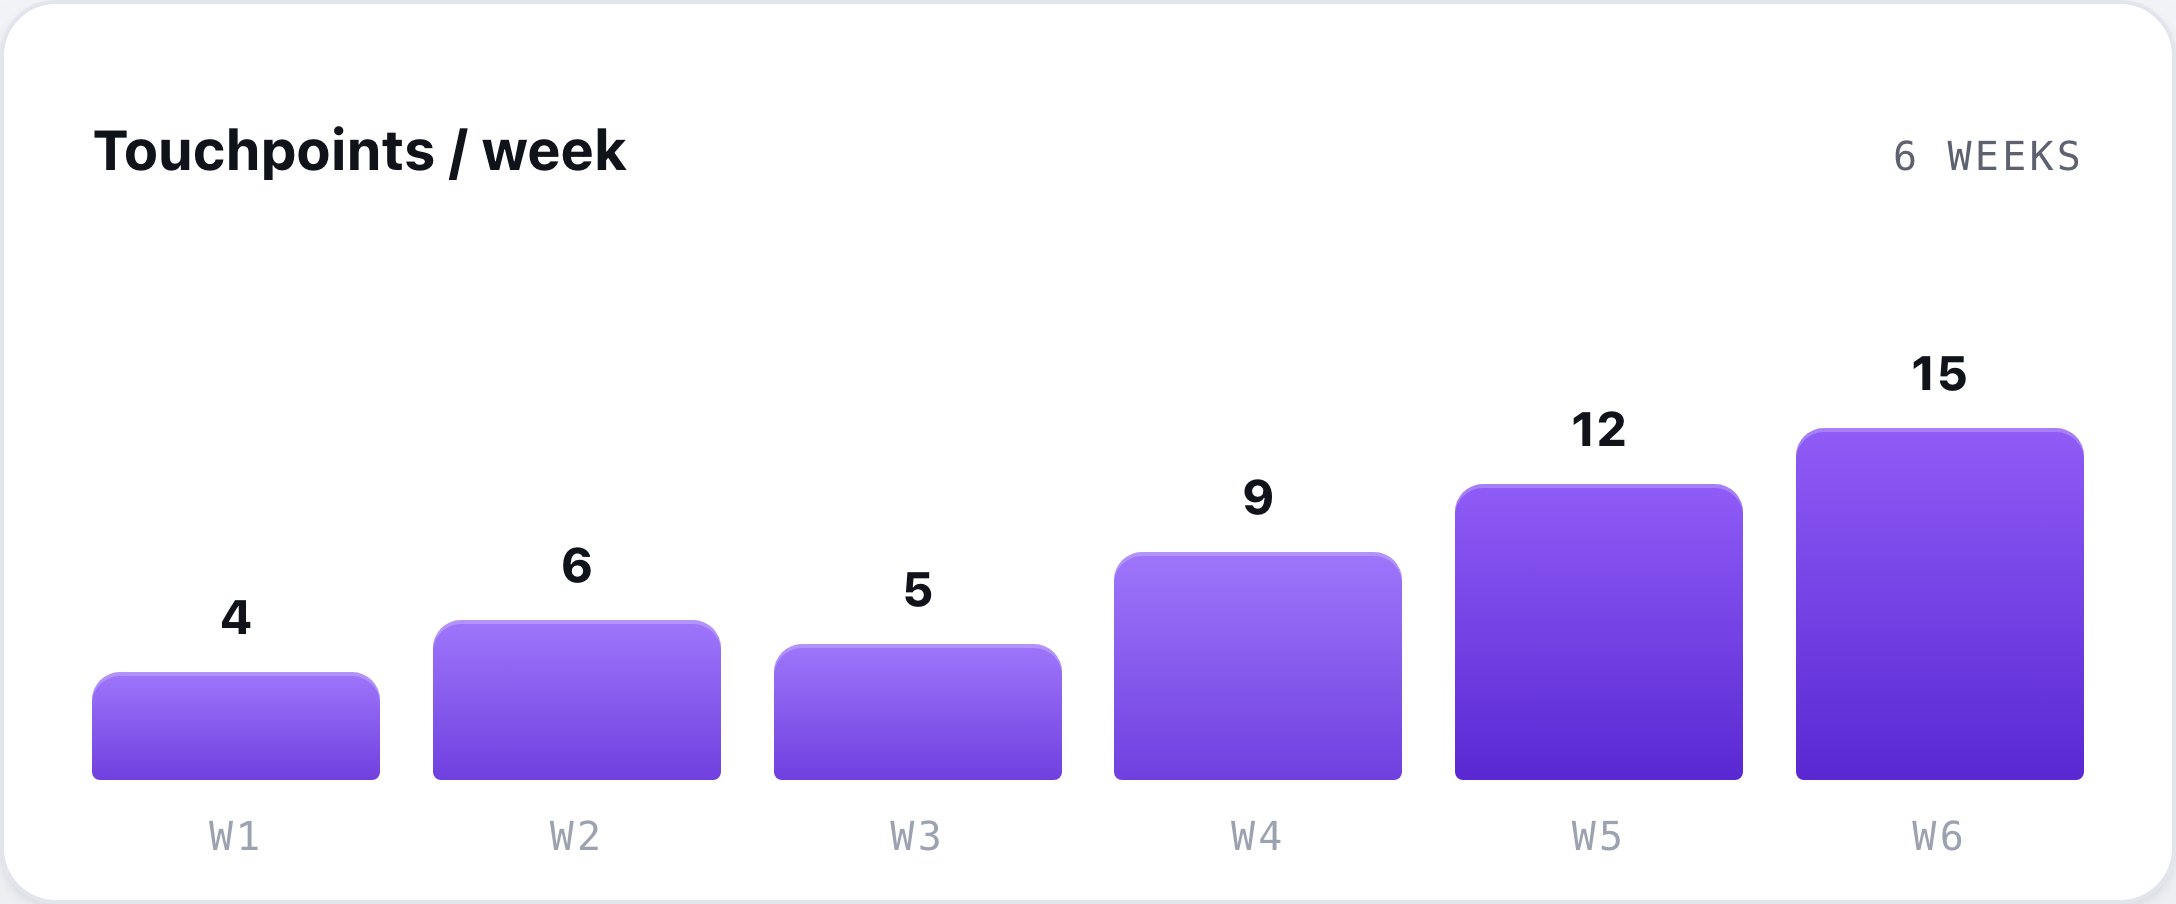
Column chart
A comparison or trend over time, such as volume per week.
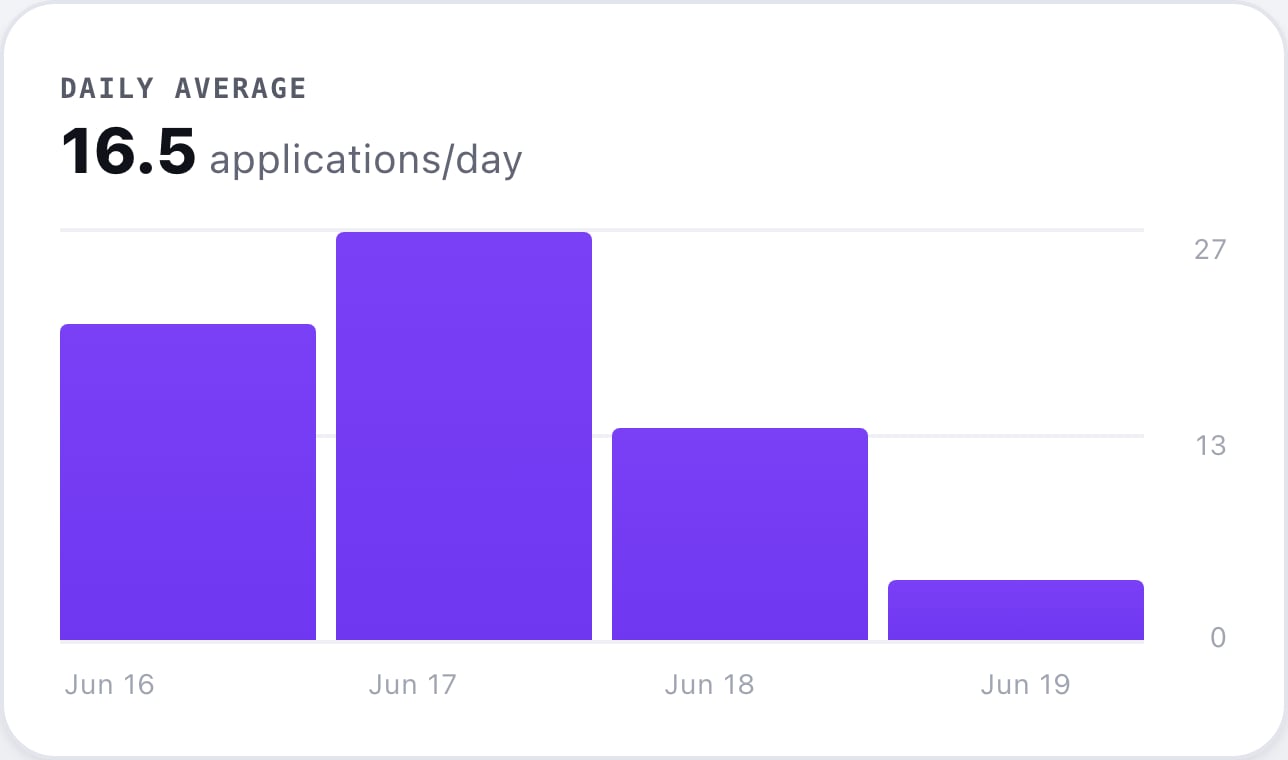
Histogram
A distribution of values over a period, like daily average volume.
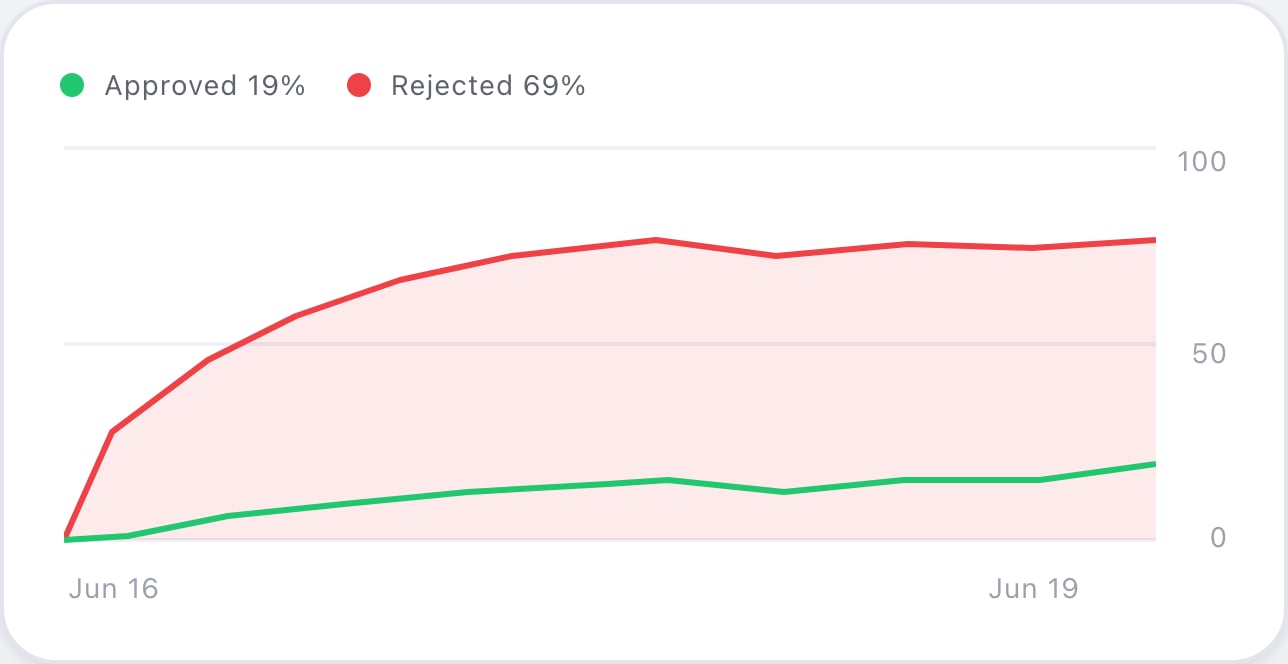
Dual line chart
Two series tracked over time - for example, approved vs. rejected.
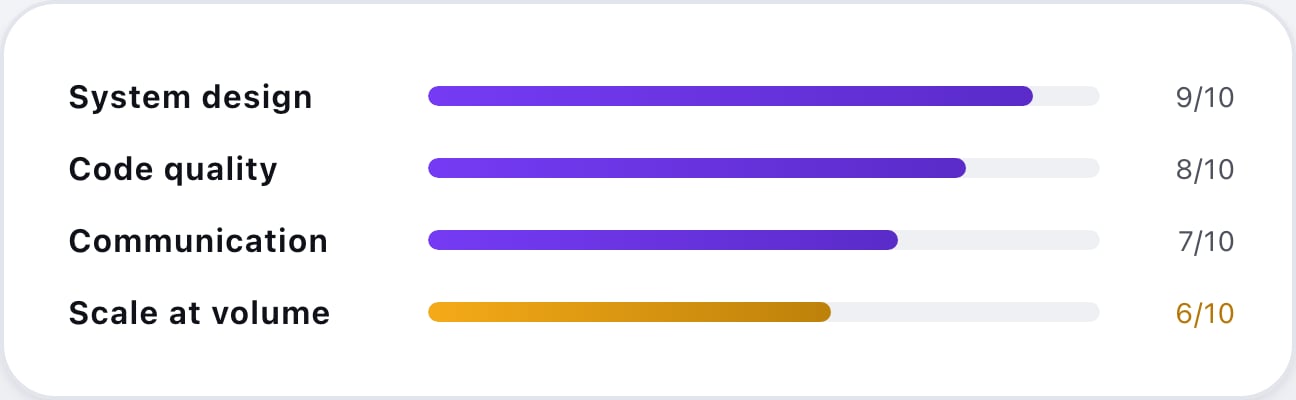
Horizontal bars
Ranked scores across categories, like a scorecard.
Findings & data
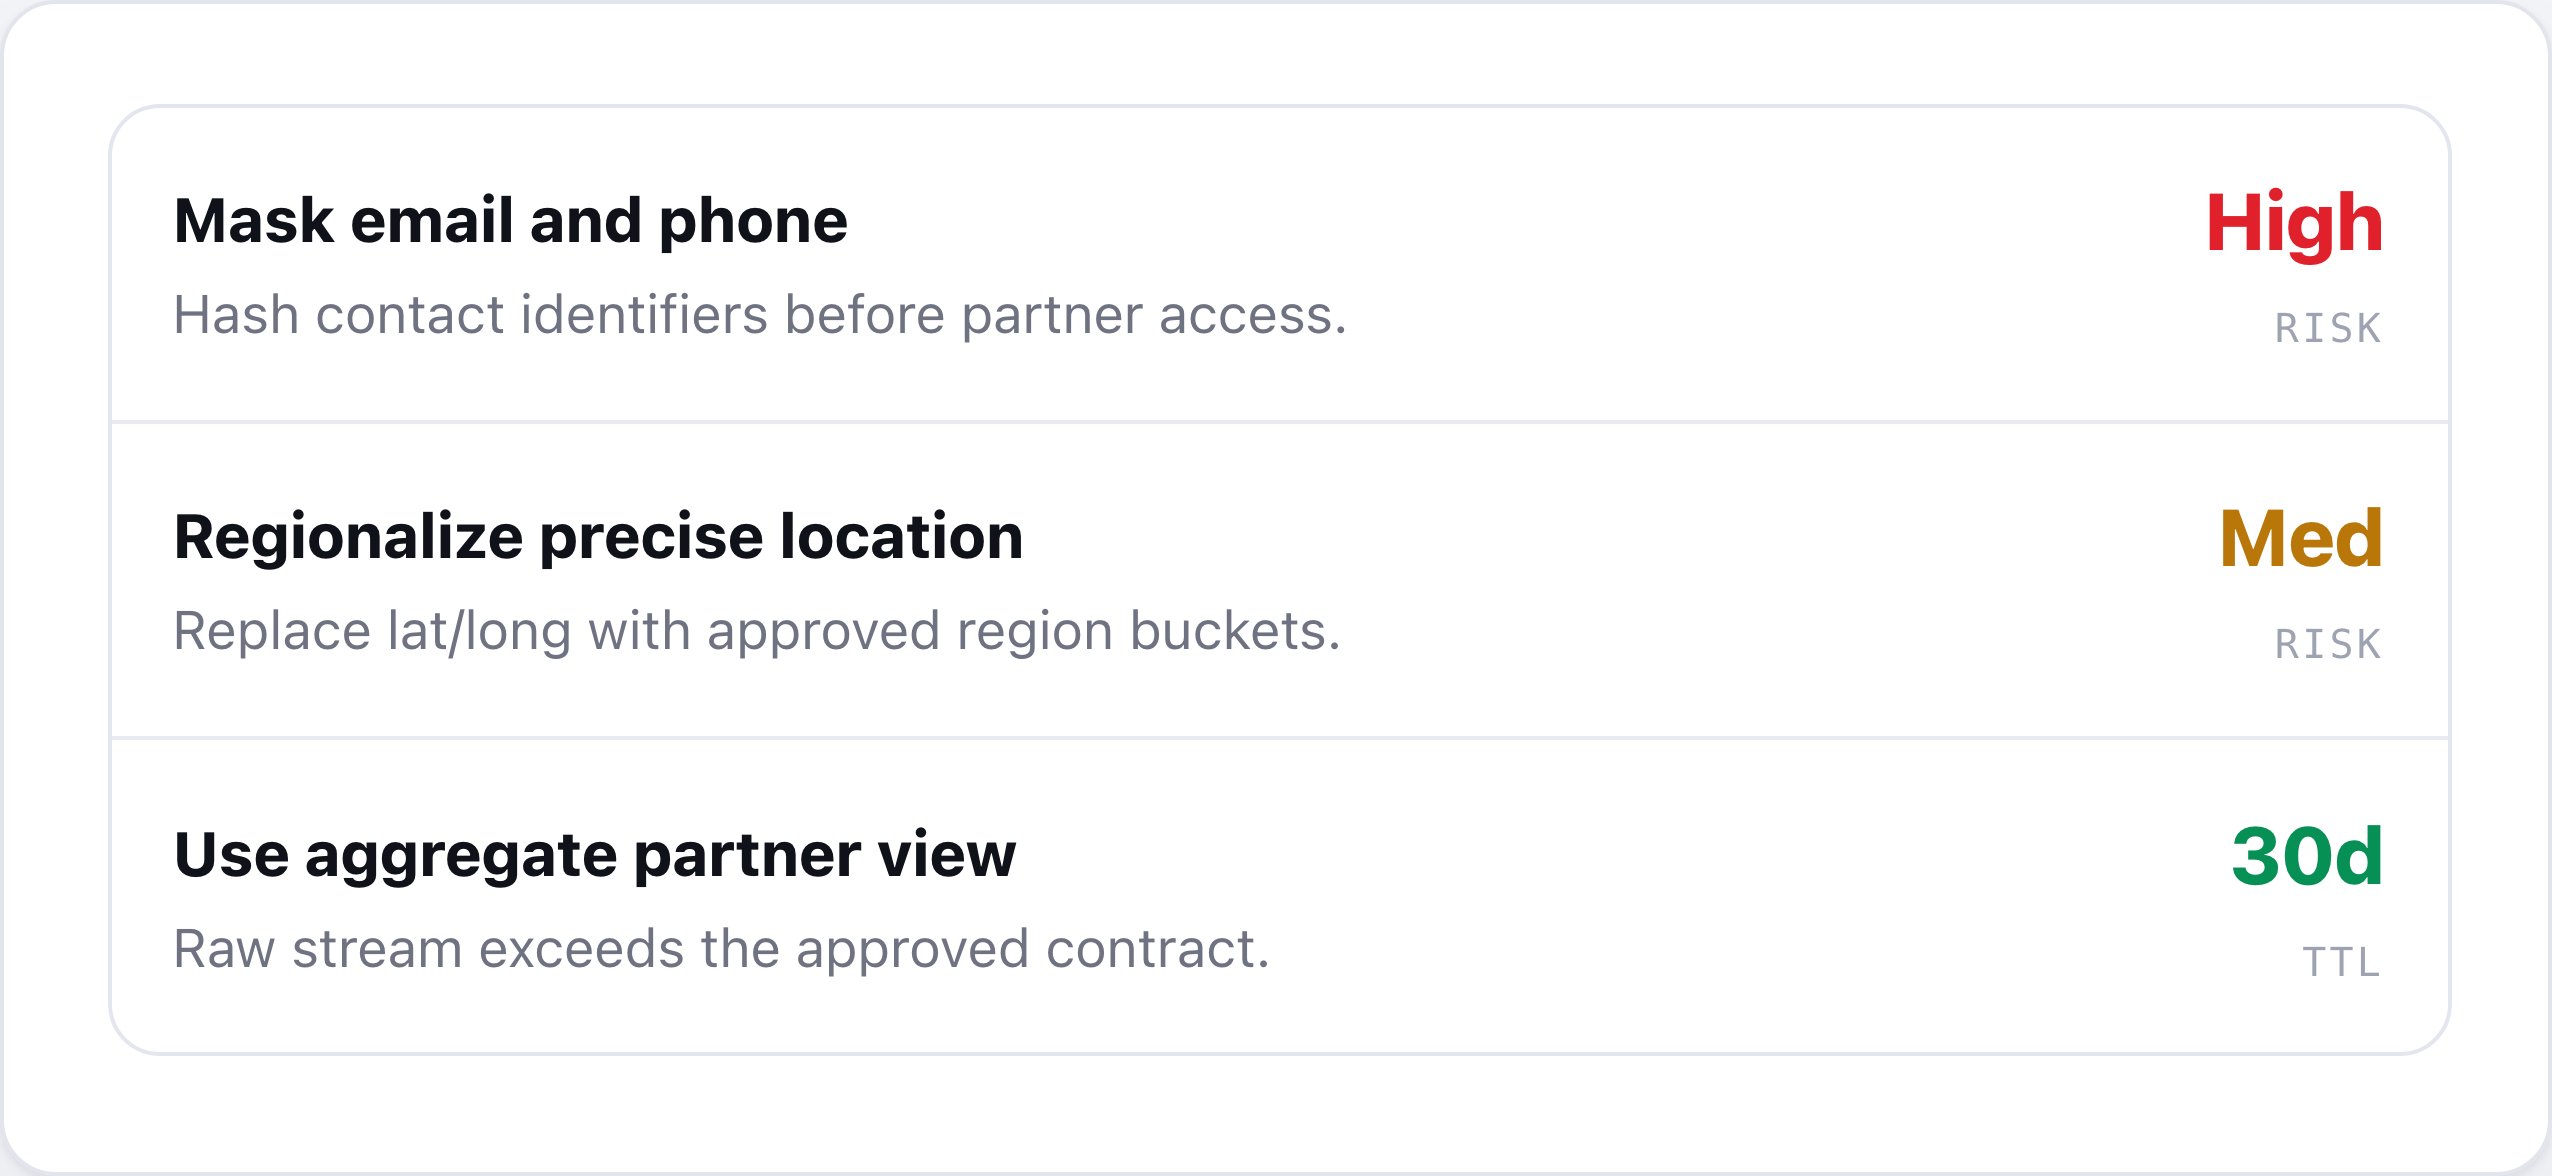
Findings list (severity)
Prioritized findings tagged by severity, with context and recommended action.
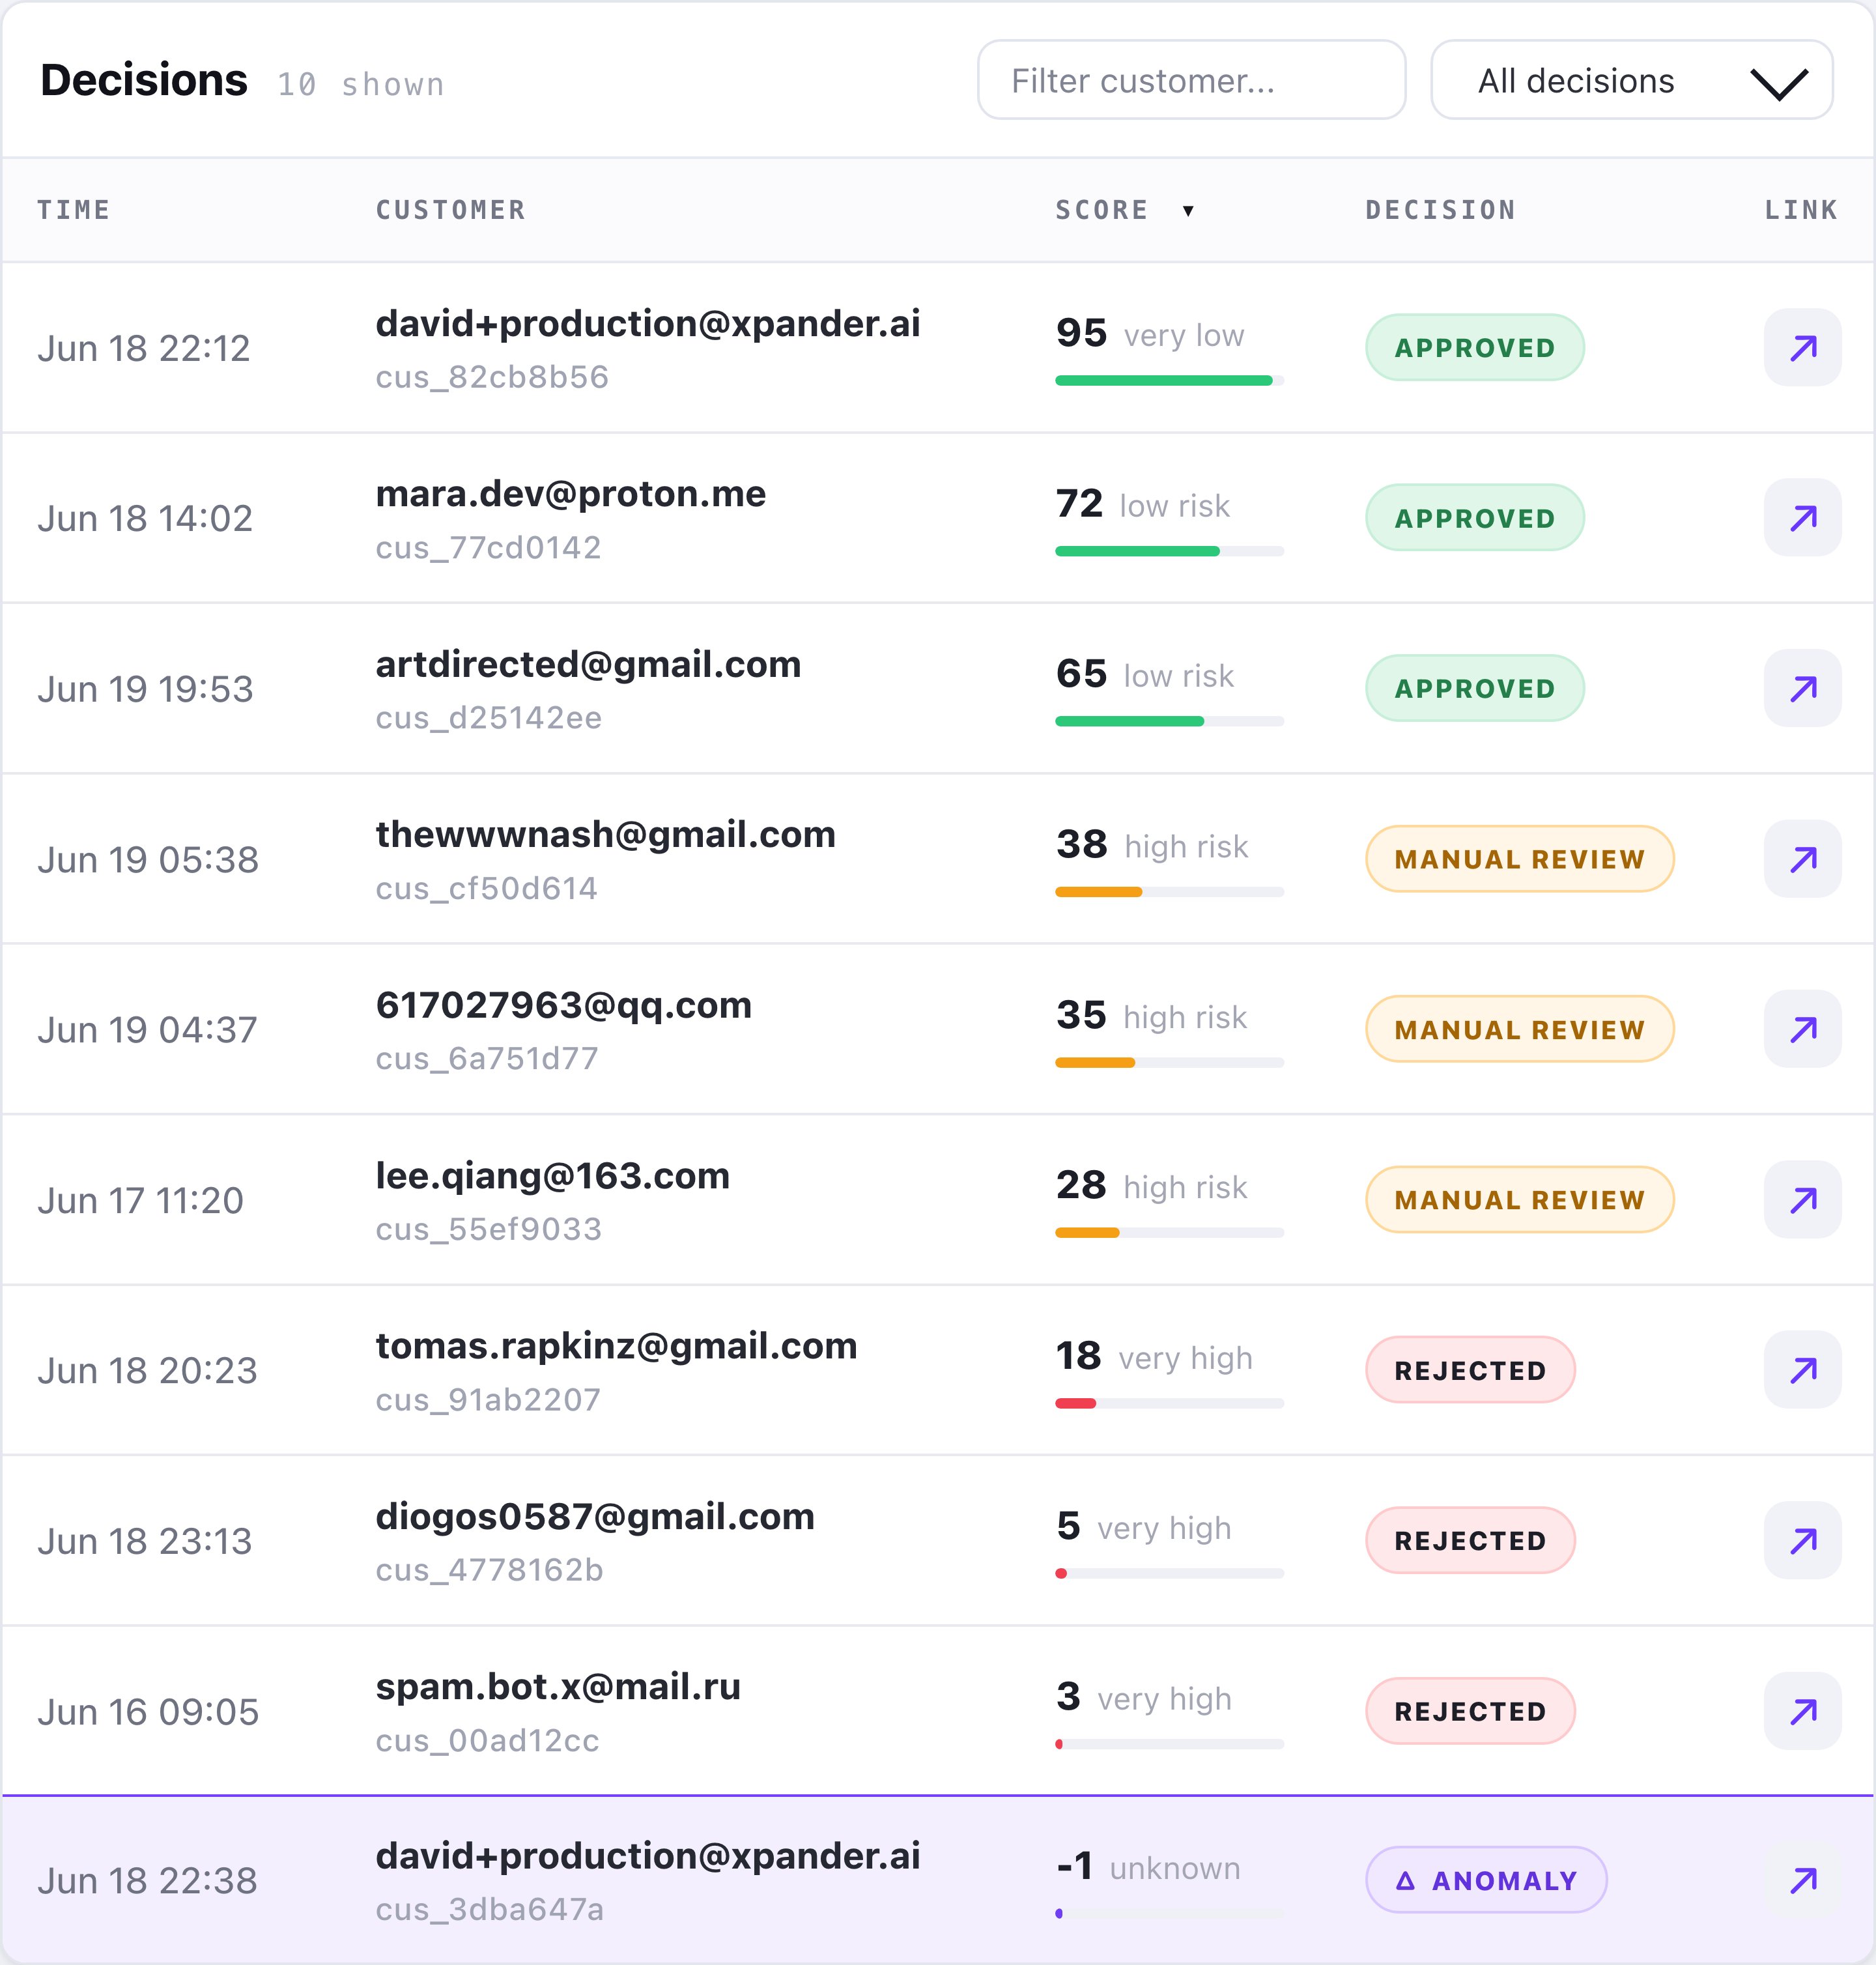
Data table (sortable + filterable)
Real rows the team can sort and filter - records, scores, risk, and decisions.
From raw work to visual context
Agents can help turn scattered information into a clear output. A workflow might start with files, APIs, tickets, messages, or database results. Omni can help organize that work into charts, tables, summaries, cards, and sections that make the result easier to understand.Where reports and dashboards live
Reports and dashboards can appear inside Agentic Applications, where they can be connected to the task, agent, files, and context that created them. This makes the output more useful than a static document. Teammates can see the result and understand where it came from.What makes a good agent-generated report
A strong report should be:- Easy to scan
- Clear about what changed
- Specific about risks or opportunities
- Connected to source context when possible
- Useful for the next decision
- Shareable with the people who need it