

Usage
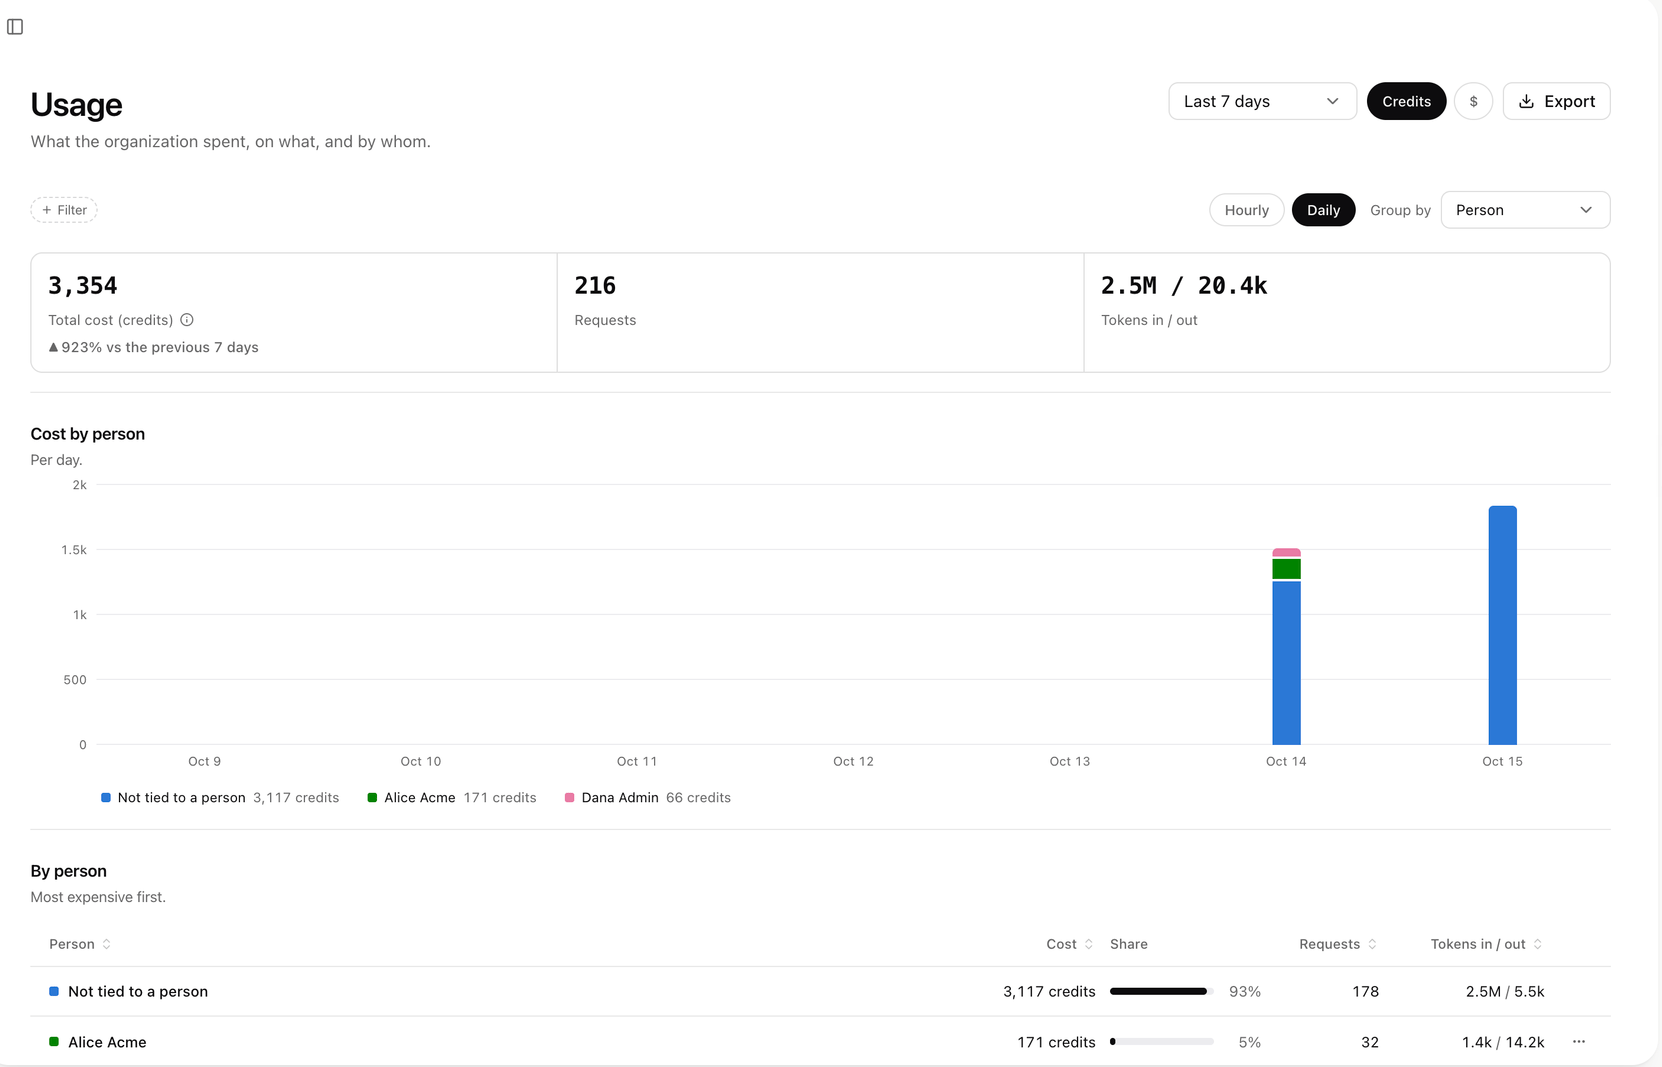
Usage grouped by person over the last 7 days. Shown with sample data.
- The top row shows Total cost, with the change against the previous period, and one tile per payer: Subscription: xpander credits for calls on keys included with xpander, Subscription: your provider keys for calls on your own keys, and Subscription: personal Claude and ChatGPT plans for calls on people’s own plans. When your organization uses only one kind of provider credential, the provider keys tile reads Subscription: API key or Subscription: IAM assume role. Requests and Tokens in / out follow.
- Group by splits the chart and the table by Person, Group, API key, Model, Client, Provider, Account, Agent or License model. Hourly and Daily set the chart’s step for ranges up to 7 days.
- + Filter narrows everything to the same dimensions. In the table, a row’s menu offers a filter for that row, such as Filter by this person, and View requests, which opens Logs with the same filters.
- Export > Download cost by … (CSV) downloads the table.
Logs
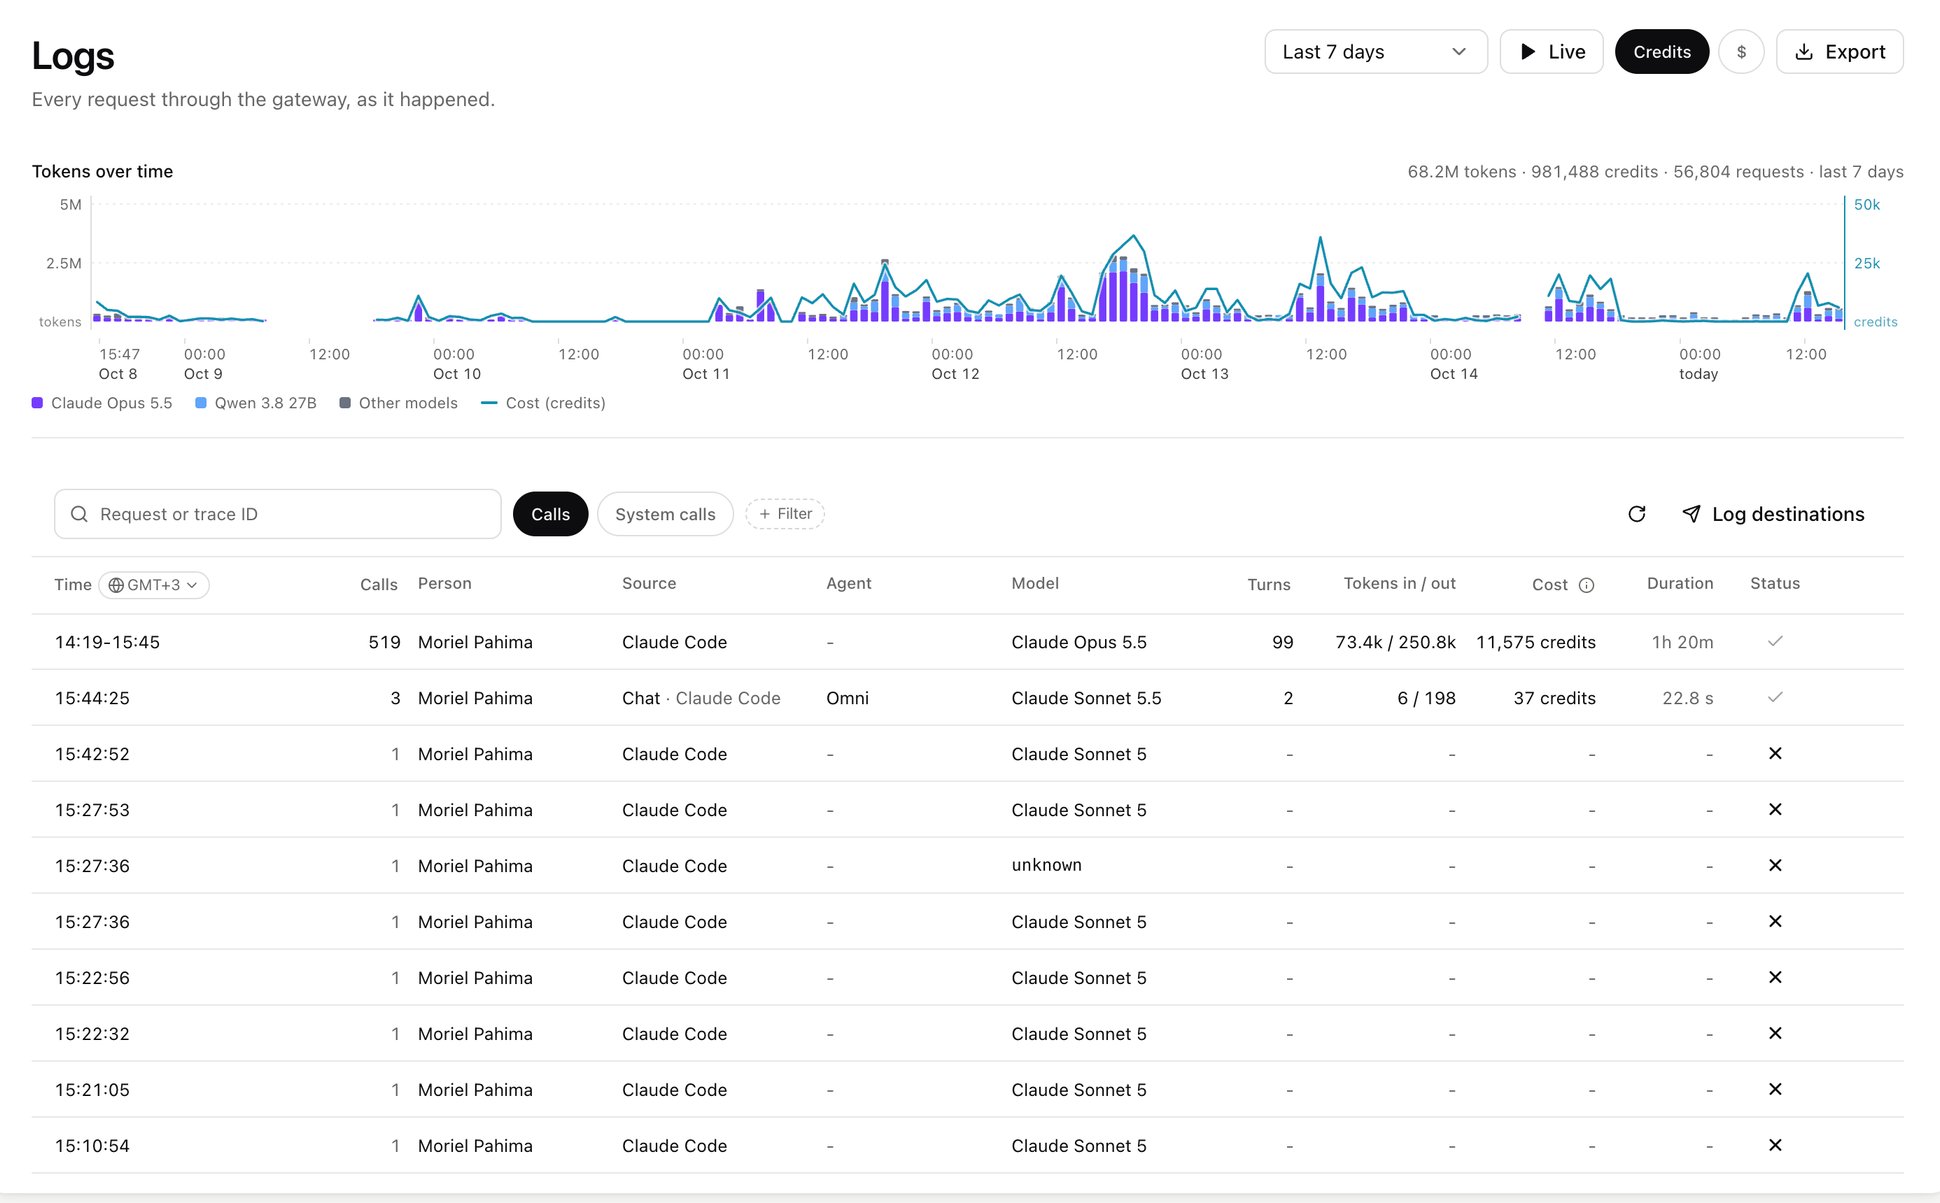
Live shows new requests as they arrive, and Pause stops the updates. The range menu and the refresh button sit beside it.
Filters
+ Filter narrows the list. Every filter you set is kept in the page address, so a filtered view can be shared as a link, and Clear filters removes them all.
Type a request or trace ID in the search box (Request or trace ID) and press Enter to open it. A request opens at
https://platform.xpander.ai/governance/logs/<request or trace ID>, so you can share it as a link.
Export
Export downloads what the filters show: Download CSV, Download JSON, or Copy as table to paste into a spreadsheet. Each row carries the time, request and trace IDs, status, person, group, agent, operation, conversation, key, model, client, license model, tokens, cost, whether it was billed, latency and the error. Exports never include prompt or response text.A trace or a request
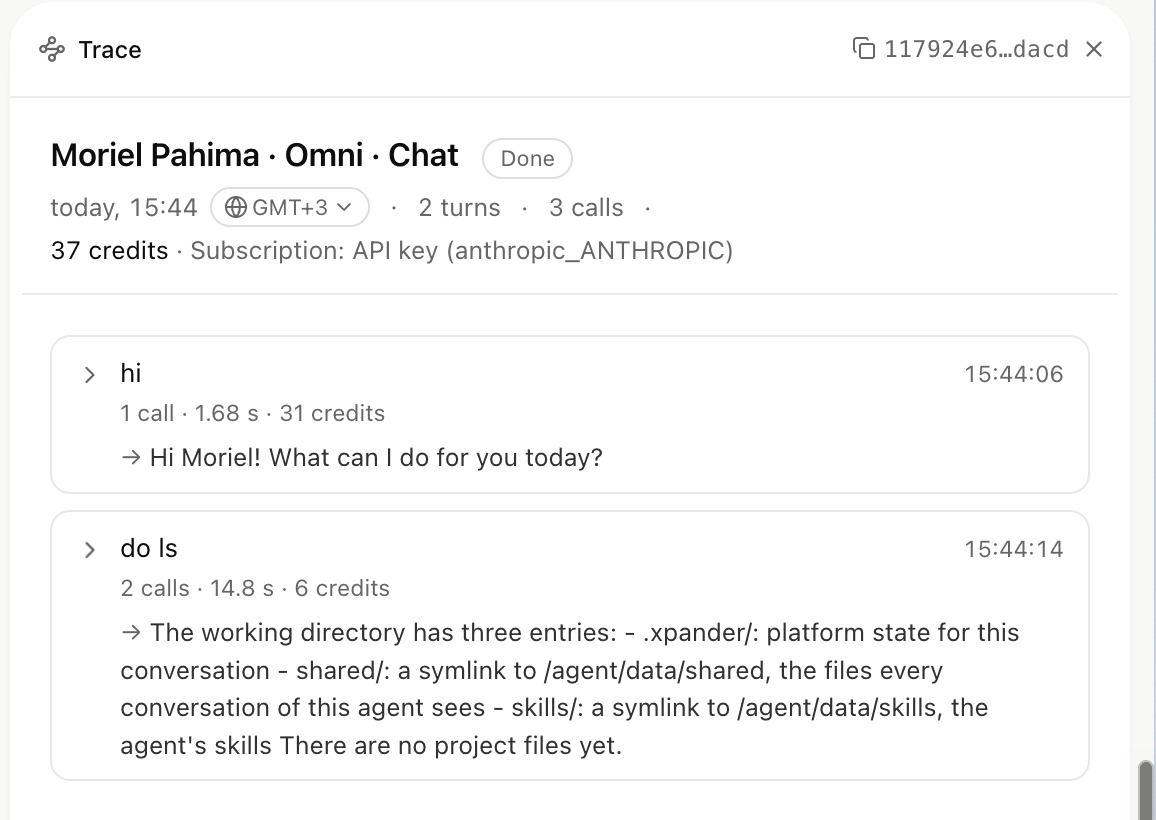
Hovering a cost shows who paid it, such as Subscription: xpander credits, Subscription: API key with the key’s name, or the person’s Claude plan.
Prompt and response text
Usage, cost and timing are always kept. Prompt and response text is kept for everyone unless an admin turns off Saved prompt text for it. A request without saved text says so on its row. Anyone whose role may view usage can open saved text, and every opened request is recorded in the Audit log. Exports and log destinations never include the text.Requests xpander makes for you
Some features call a model on your organization’s behalf: conversation titles and summaries, building an API connector from its spec, generating an agent’s details, checking custom function code, image generation and transcription in built-in skills, and bot replies. These requests appear in Logs like any other, so you can see every model call made for your organization.- The Person column shows the person who started the work, such as an admin creating an API connector, or
-when no one did. - The Source column names the operation’s step, such as Tags step. Hover it for the operation, such as Connector generator, what it does and who started it.
- The cost reads Not billed when the request ran on xpander’s own key; hover it for the cost xpander measured. These requests use no credits and count toward no budget.
- When the request ran on your own provider key, which is always the case on a self-hosted install, your provider bills it, so the row shows its cost.
- A few operations are charged in credits, such as scoring an agent’s answers in evaluations. Their rows show the cost like any other request.