Available charts
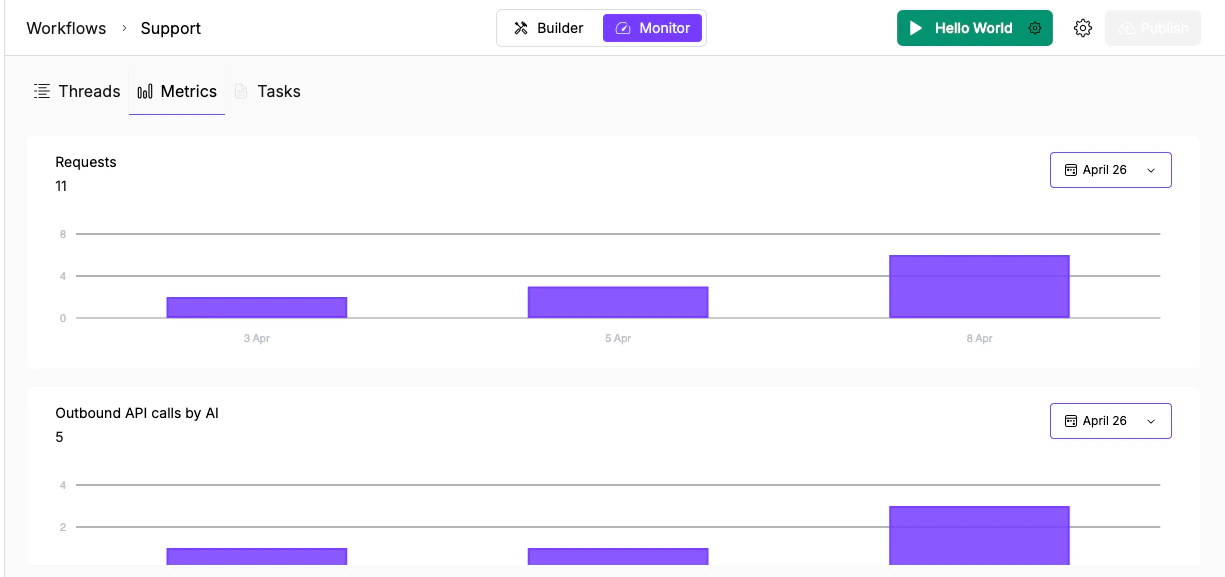
Requests per day (11 total) and Outbound API calls by AI (5 total) as purple bar charts with date filtering.
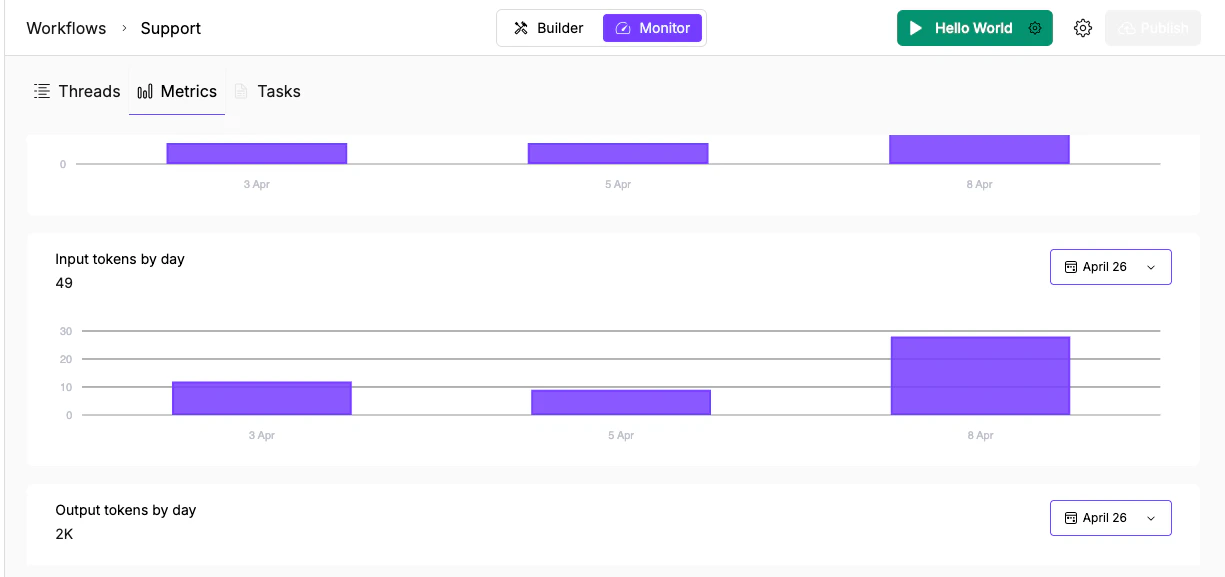
Token usage charts: Input tokens (49 total) and Output tokens (2K total) with the same date-filtered format.
Reading the charts
Each chart shows:- Total count in the header (e.g., “Requests: 11”)
- Purple bar chart with dates on the X axis
- Date range picker (calendar icon) in the top right to filter the period
Investigate a spike
When a chart shows an unexpected jump:- Note the date of the spike in the relevant chart
- Switch to Threads and look for threads created on that date
- Check whether the spike is concentrated on one trigger type or spread across sources
- If the API calls chart also spiked, check whether an agent node called the same tool repeatedly (possible loop or retry issue)
- If only input tokens spiked, check whether conversation history or memory is accumulating without bounds
Cost optimization
The token charts are the most actionable for cost control:- High input tokens relative to output may mean you’re sending too much context. Consider adding a Summarizer node before expensive Agent nodes to compress the input.
- If a particular day shows a token spike, cross-reference with the Threads tab to find which execution consumed the most.
- Compare token usage before and after switching a node to a cheaper model tier (T2 or T3) to confirm the savings. Use the tier guidance to decide which nodes can safely move down without affecting output quality.
What’s next
Threads
Trace the full execution log to find where a run went wrong.
Task Monitoring
Scan executions by status and triage failures across agents.