This page is being phased out. For the current way to track agent executions, see Tasks in the User Guide.
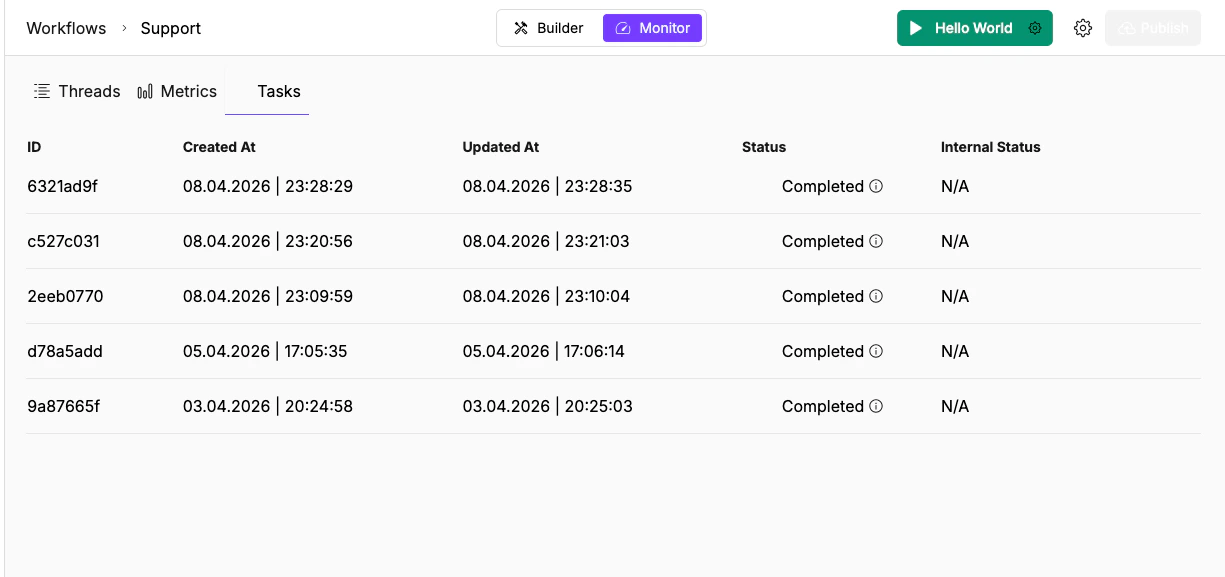
Tasks table with 5 completed executions showing ID, Created At, Updated At, Status, and Internal Status columns.
Task table columns
Task statuses
Tasks vs. Threads
Use Tasks when you’re triaging across many runs (scanning for failures, checking completion rates). Use Threads when you need to debug a single run in depth (reading payloads, tracing tool calls). A single thread (conversation) can contain multiple tasks. Each task is one invocation of the agent or workflow, but tasks in the same thread share conversation context throughsession_id.
Global Tasks page
The sidebar has a dedicated Tasks page (the checklist icon) that shows tasks across all agents. Same columns, but with an additional Agent Name column so you can see which agent each task belongs to. Use the global view when you need to triage failures across your entire workspace rather than one agent at a time.Triage failures
When you notice a cluster of Stopped tasks:- Open the global Tasks page to see executions across all agents
- Scan by Status for clusters of Stopped tasks
- Note whether failures are concentrated on a specific date, time, or agent
- Click a Stopped task to get its task ID
- Switch to the agent’s Threads view and find the parent thread
- Open the execution log and look for the last successful step before the failure
What’s next
Threads
Trace the full execution log to find where a run went wrong.
Metrics
Spot anomalies in request volume and token usage before diving into individual threads.